
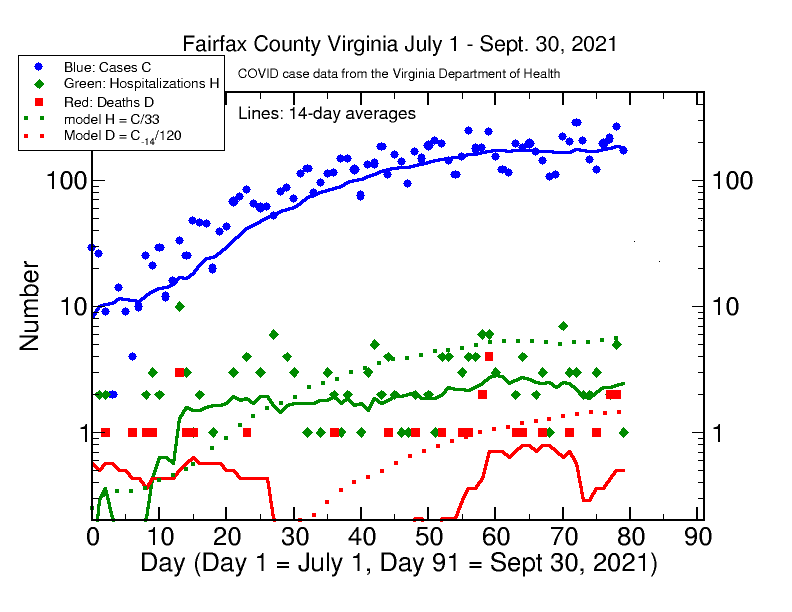
An update for Sept. 30 is below: the good news continues.
An update for Sept. 17 is below.
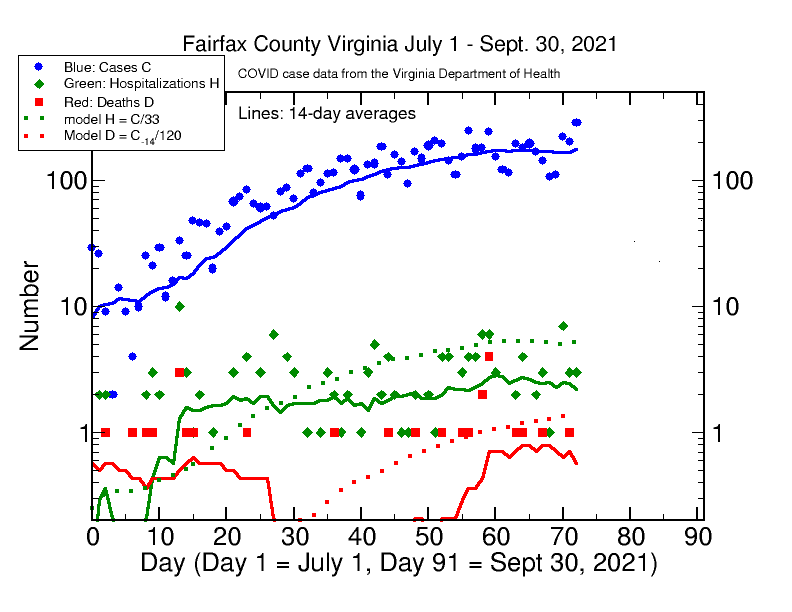
Sept. 10, 2021: After 2 weeks of more data, it is time to update my Fairfax COVID tracker. The news is relatively good for Fairfax. Cases had been level around 170 cases per day (14.7 per 100,000) for the last couple of weeks and even had been trending downward slightly. The last 3 days have given a slight uptick but we will need to wait and see whether a new trend develops. Hospitalizations and deaths remain quite low with stable rates that remain around half of my model predictions based on last year’s pandemic (dotted lines). And Fairfax has much better rates for all three measures than the rest of the USA as a whole (see below).
As for age, the number of cases in Fairfax among those under 18 continues to creep up. School has now been in session for 19 days here. The under 18 group represents 28 percent of the 748 cases total in the last 4 days. This represents an 87 percent increase in the case rate for this age group from its 15 percent of total cases over the last year and a half (13000 for under 18 out of 86000 total cases). By contrast, the number of recent cases in the 65+ age group is down by 30 percent from its pandemic average and is now only 7 percent of recent cases instead of the pandemic average of 10 percent of total cases. Thus, recent cases show a clear shift from older to younger. This shift is a likely factor in the decrease in hospitalization and death rates. The shift and decrease may also be due to the higher vaccination rate among older people and a lower rate among younger ones since most cases occur among the unvaccinated. Of the 14 COVID deaths in the last 4 weeks in Fairfax (ending Sept. 10), only 8, representing 57 percent, are for the 65+ group, whereas the pandemic average for this oldest group had been 82 percent of total deaths. I do not know the vaccination status of these 14 who died, but if data from elsewhere can be a guide, all of them, or maybe all but one, were likely unvaccinated.
To compare to elsewhere, the case rate per capita for the USA as a whole is 3 times higher than that of Fairfax and the death rate per capita is 8 times higher. The current death rate per capita in Florida is 26 times higher than for Fairfax and 3 times higher than for the USA as a whole. Florida is an outlier in these statistics–only Mississippi has a higher death rate per capita. Interestingly, Florida has a similar vaccination fraction to Fairfax (65 versus 67 percent for one dose or more). It does make a difference where you live. I am convinced that vaccination, masking, and other social practices have a big effect on the local course of this pandemic, which, in one way or another, affects everyone.
Update for Sept. 17: The counts for cases, hospitalizations and deaths continue to be relatively stable and steady in Fairfax, subject to the usual daily fluctuations. The graph below updates the previous one for Sept. 10. For the last 3 weeks the 14-day average number of cases has varied by plus or minus 10 cases around an average of 175 per day (15 cases per 100,000 population), and hospitalizations have averaged around 2.5 per day and deaths around 1 every 2 days, both remaining better than the predictions from my earlier model. All three rates remain much smaller than in most of the USA. There still is no evidence of a “school surge” in total cases (since cases are remaining flat 25 days after the start of school), although the case distribution tends to be younger with Delta than in the earlier pandemic. Since July 1, the under 18 age group has nearly doubled its fraction of cases, now up to 28 percent of total cases in the last 2 weeks; all other age groups have maintained or decreased their fraction of total cases relative to the pandemic prior to July 1. Of the 9 deaths in the last 3 weeks, 67 percent have been in the 65+ age group and the remaining 33 percent in the 18 to 64 age group.
Depending on whether one takes the 1-, 2-, or 3-week average for the COVID death rate per capita in Fairfax, one gets a rate that is from 30 to 40 times smaller than the current per capita COVID-19 death rate in Florida. As for other recent weeks, Fairfax remains much better in this regard than much of the rest of the country. This raises the natural question: why is there such an enormous disparity in this crucial measure in different parts of the country? And why is Fairfax doing so well? I address this in my post on August 19.
Update for Sept. 30: The news continues to be good for Fairfax County. Daily cases remain steady and even slightly declining, while hospitalization and death rates remain quite low compared to much of the rest of the country and compared to what they were earlier in the pandemic. There were 5373 cases, 76 hospitalizations, and 15 deaths in September in Fairfax, giving average daily case, hospitalization and death rates of 179, 2.5, and 0.50 respectively. These correspond to 1 hospitalization per 70 cases and 1 death per 360 cases. These rates, now shown as the NEW model on the graph, account for the current data and are now one half and one third of the corresponding rates between March 2020 and June 2021. They are getting closer to, but still are a few times larger than, the rates associated with the seasonal flu.
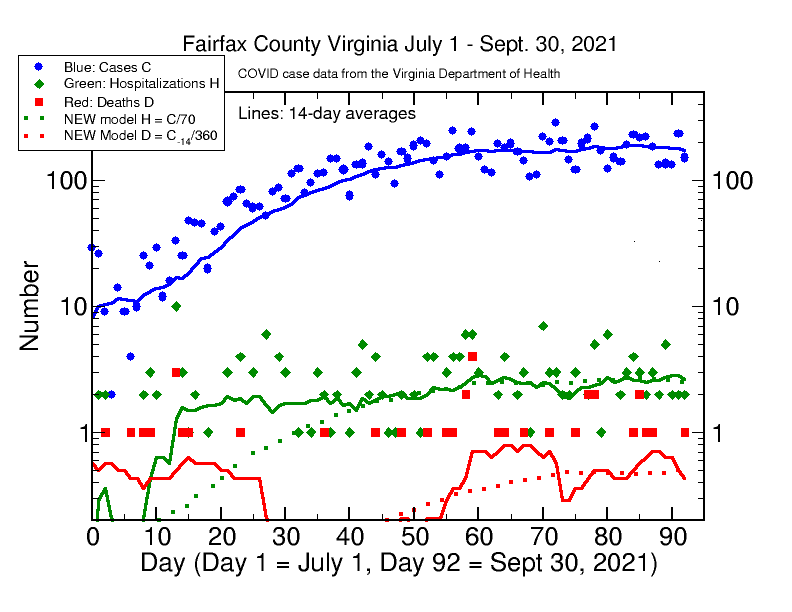
The case-by-age category showed 30 percent of total cases in the last week in the under 18 age group, which is double the percentage in this age group for the whole pandemic. The 18-49 age group dropped from a pandemic average of 55 percent of cases to only 44 percent of cases last week. The over 50 age group contributed 26 percent of cases compared to their pandemic average of 30 percent. Thus there is a definite shift in the percentages of cases to the under 18 category, although total cases over a month after school started have been holding steady and now may be declining slightly. Thus, there does not seem to be any major “school surge” in cases in Fairfax, although the increase in under-18 cases has kept the overall number from dropping as it otherwise would have.
The majority of deaths still occur in the oldest 65+ group, which had 69 percent of the deaths in September, down from its pandemic average of 81 percent. By contrast, the under 65 age group represented 31 percent of deaths in September, up from its pandemic average of 19 percent. Thus while the overall death rate per case is down three-fold from its pandemic average, the deaths seem to be shifting to a younger age. The one caveat in this analysis is that the numbers are sufficiently small that they may be subject to statistical fluctuation.
Fairfax remains much better than the rest of the USA, for which the average case rate per capita is twice as large as in Fairfax and the death rate per case is 6 times larger. If we scaled the national averages to the population of Fairfax, we would be having 6 to 7 deaths per day here instead of the actual rate of one death every 2 days, that is, the per capita death rate is around 12 times larger in the USA as a whole than in Fairfax.
If we take the Covid death rate per capita as a measure, even “blue states” like California, Massachusetts, New York, Maryland, or Colorado have a current rate roughly 3 to 4 times higher than in Fairfax. But the death rate per capita in “red states” like Florida, Alabama, South Carolina, or West Virginia is now 20 to 40 times higher than in Fairfax. This “red/blue” difference is evident pretty much across the board from the data I have examined (other studies have reached the same conclusion). It is both tragic (to all) and angering (to me) that we as a nation have allowed our political polarizations and media dysfunction to produce such a tragic and frightening disparity in public health impact for a pandemic that could have been (and some places is being) controlled much better. Certainly, tens of thousands, and likely hundreds of thousands, of Americans would still be alive today if more people could have only paid attention to wise, objective, and sound counsel of those who have the real scientific and medical knowledge to tell us how to lower our risk and stay healthy (we can lower but never eliminate ALL risk). Given the data for Fairfax, people here seem to be paying attention better than many in the rest of the country. But overworked, exhausted, dispirited yet heroic medical workers in our hospitals and ICUs are paying the price of treating far too much preventable disease in far too much of this country. Enough said.
