
Summary
Just how dangerous is the Cronavirus pandemic going on now? I started a web page last spring to keep track of information and data, but have been inactive with it since August. This new page uses data from March 2020 through January 12, 2021, to address and revise my estimates from last spring comparing COVID-19 to the seasonal flu.
My conclusion from the current Fairfax data, explained in detail below, is that one (but not only) measure of pandemic seriousness, the case death rate, is approximately 0.5 percent, which is roughly 4 times that of the seasonal flu (consistent with estimates from the CDC and WHO), and is about 10 times lower than I estimated last spring. Such estimates can only be approximate. But it is important to note that the case death rate varies strongly with age: the disease disportionality kills older people. For example, of the roughly 50,000 cases so far in Fairfax County, only 11 percent of the cases have been in people over 65, whereas 82 percent of the deaths involved people over 65. The data (as of Jan. 17, 2021) show that someone 65 or older has a 1 in 10 chance of dying if they get COVID-19 in Fairfax County (615 deaths from 5909 cases). By contrast, the odds of dying are only 1 in 1000 for those aged 18 to 49 (30 of 30,237 cases), and 1 in 100 for those aged 50 to 64 (101 of 11019 cases), and no one under 18 (6760 cases) has yet died of COVID-19 in Fairfax County.
The graphs and analysis below draw upon public data from the Virginia Department of Health on overall COVID-19 cases, hospitalizations, and deaths in Virginia’s counties. The data in the graphs below are for Fairfax County only, where I live. Fairfax has a population of 1.17 million, and between March 17, 2020 and Jan. 12, 2021 recorded 50,278 cases of COVID-19, 3085 hospitalizations, and 715 deaths (these numbers are very slightly smaller than reported on the Fairfax County web site). According to these data, 6.1 per cent of total cases result in hospitalization and 1.4 per cent of cases result in death. This case death rate (ratio of deaths to cases) is similar to but a bit lower than that in many countries (the rate is generally below 2.5 per cent now in most countries), and is 1.7 per cent in the USA as a whole (Source: John Hopkins University). My analysis below suggests that the true case death rate is likely closer to 0.5 percent.
Many data sites demonstrate that COVID deaths follow tested COVID cases. It is realistic to assume that deaths represent approximately 0.5 to 1 percent of known cases. Consequently, if 70 percent of the US population had to have COVID to obtain “herd immunity,” there would be between 1.1 and 2.3 million deaths. So far, we have had only 0.4 million. This indicates the USA could still have a million or more deaths to go before we reach immunity if there were no vaccinations. That represents a lot of avoidable bereavement. Rapid vaccination deployment is likely to cut this large number of unnecessary deaths dramatically. Therefore, everyone who can should be vaccinated as soon as possible, and masking and other mitigation strategies should remain in force until we have enough of our population vaccinated. Vaccination is to the only safe route to herd immunity without unnecessary excess deaths. We can still save hundreds of thousands of lives by responding well to our COVID-19 crisis.
Cases
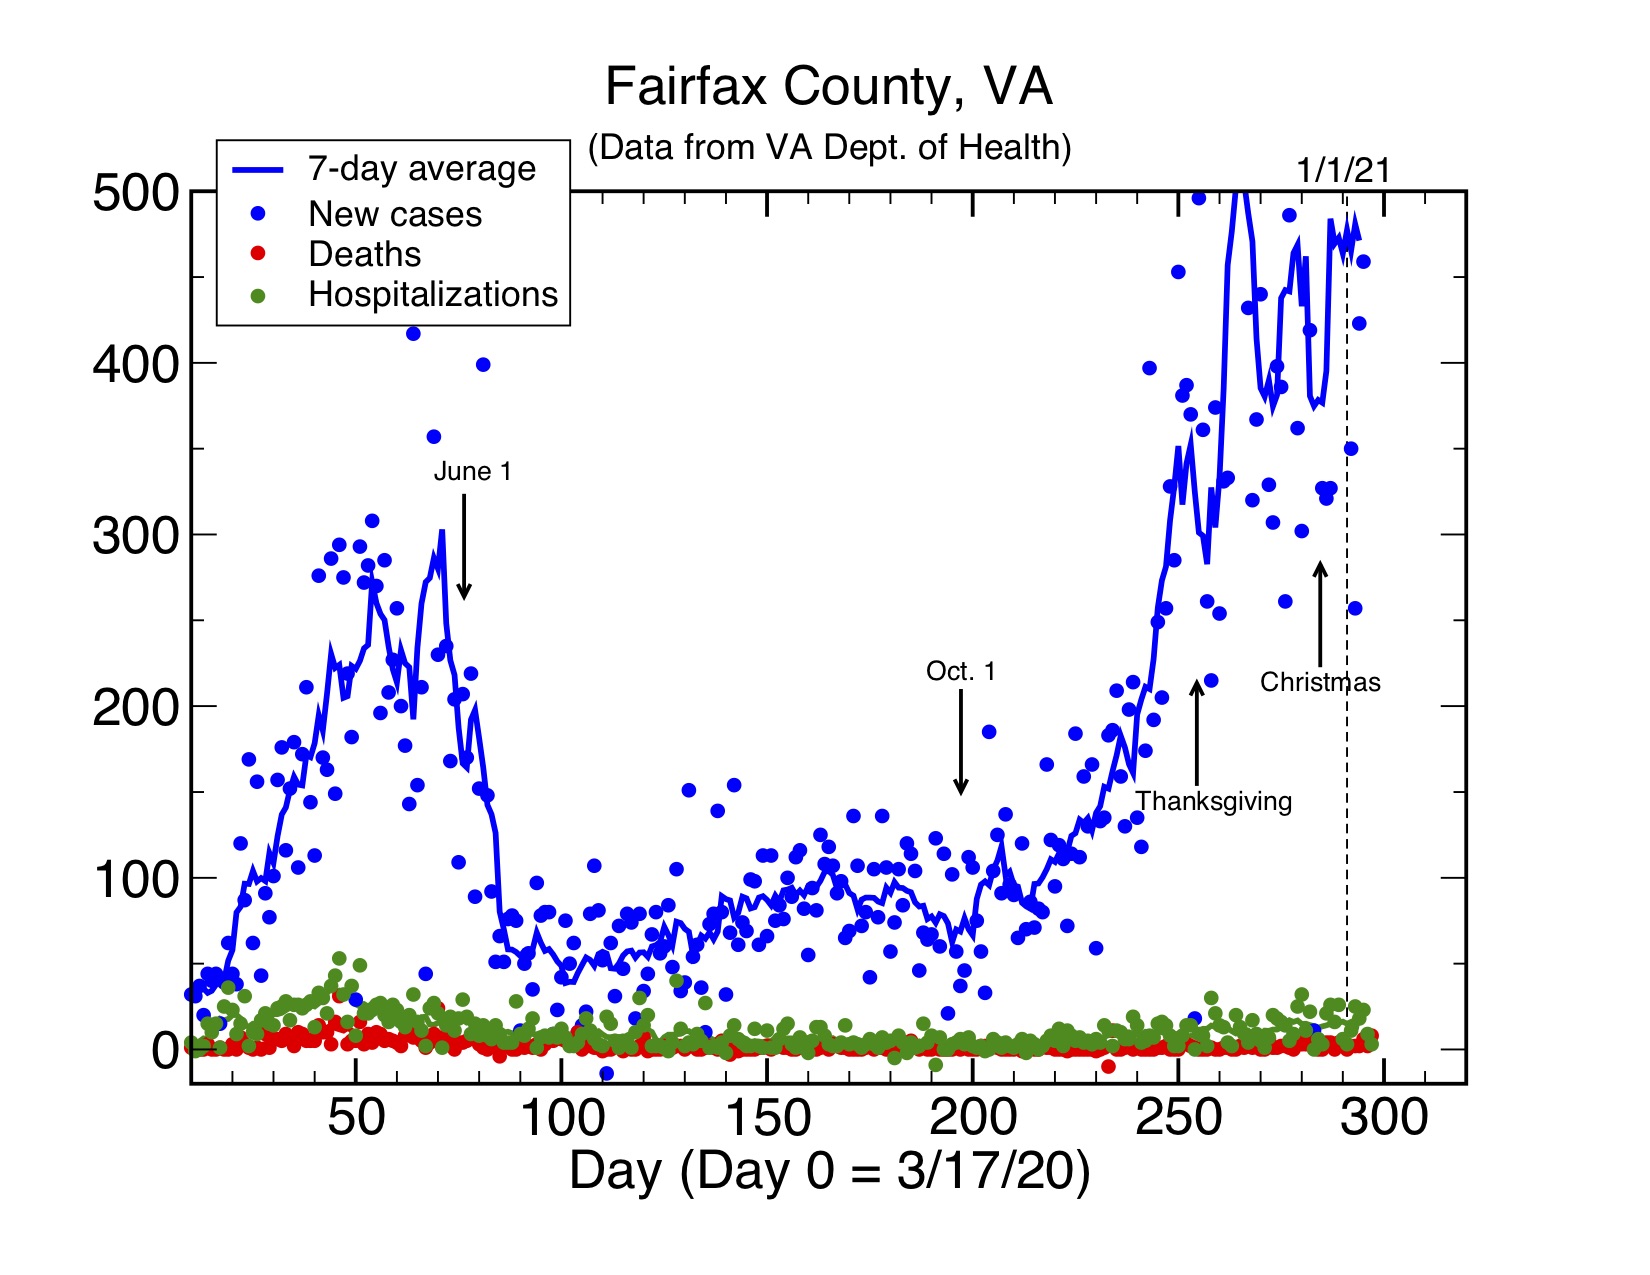
The graph below shows the number of cases per day and also gives a 7-day average of the data. There are clear daily fluctuations in the data, but the average reflects longer-term trends. First, there was a rapid ramp-up of case starting in March, which had leveled off considerably by early June and dropped to a relatively “flat” value around 100 cases per day from the middle to June to the middle of October. This has been followed by a rapid ramp-up of cases through November, quite possibly due to an increase of indoor activity. Case rates for the last few weeks have been running nearly twice what was reported last spring and more than 5 times the July average. We await future data to see where this will go. I only note that yesterday (Jan. 17) the number of cases hit an unprecedented 1485, the highest ever. This is still a very dangerous disease, since cases predict deaths accurately according to the case death rate.
Hospitalizations and deaths
The graph below gives an expanded view of the daily hospitalization (green) and death (red) data in the graph above. The data fluctuate greatly, (plus or minus approximately 100 percent) but the 7-day averages show clear trends. First, there is a notable difference from the case data: the number of hospitalization and deaths tend to be significantly lower now on the average than last spring, although the number of cases is higher. To make an educated guess, I expect this at least in part is due to the lack of testing in the spring during the early phase of the pandemic. Thus, cases were undercounted in the spring (that is, the number of actual cases was much higher than counted). If we assume the hospitalization rate (the number of actual hospitalizations per real case) is about the same throughout, then the number of cases last spring may have been approximately double the number of cases now, that is, around 4 times the actual number reported. This is consistent with the hospitalization data now showing about half of the number of hospitalizations in the spring.
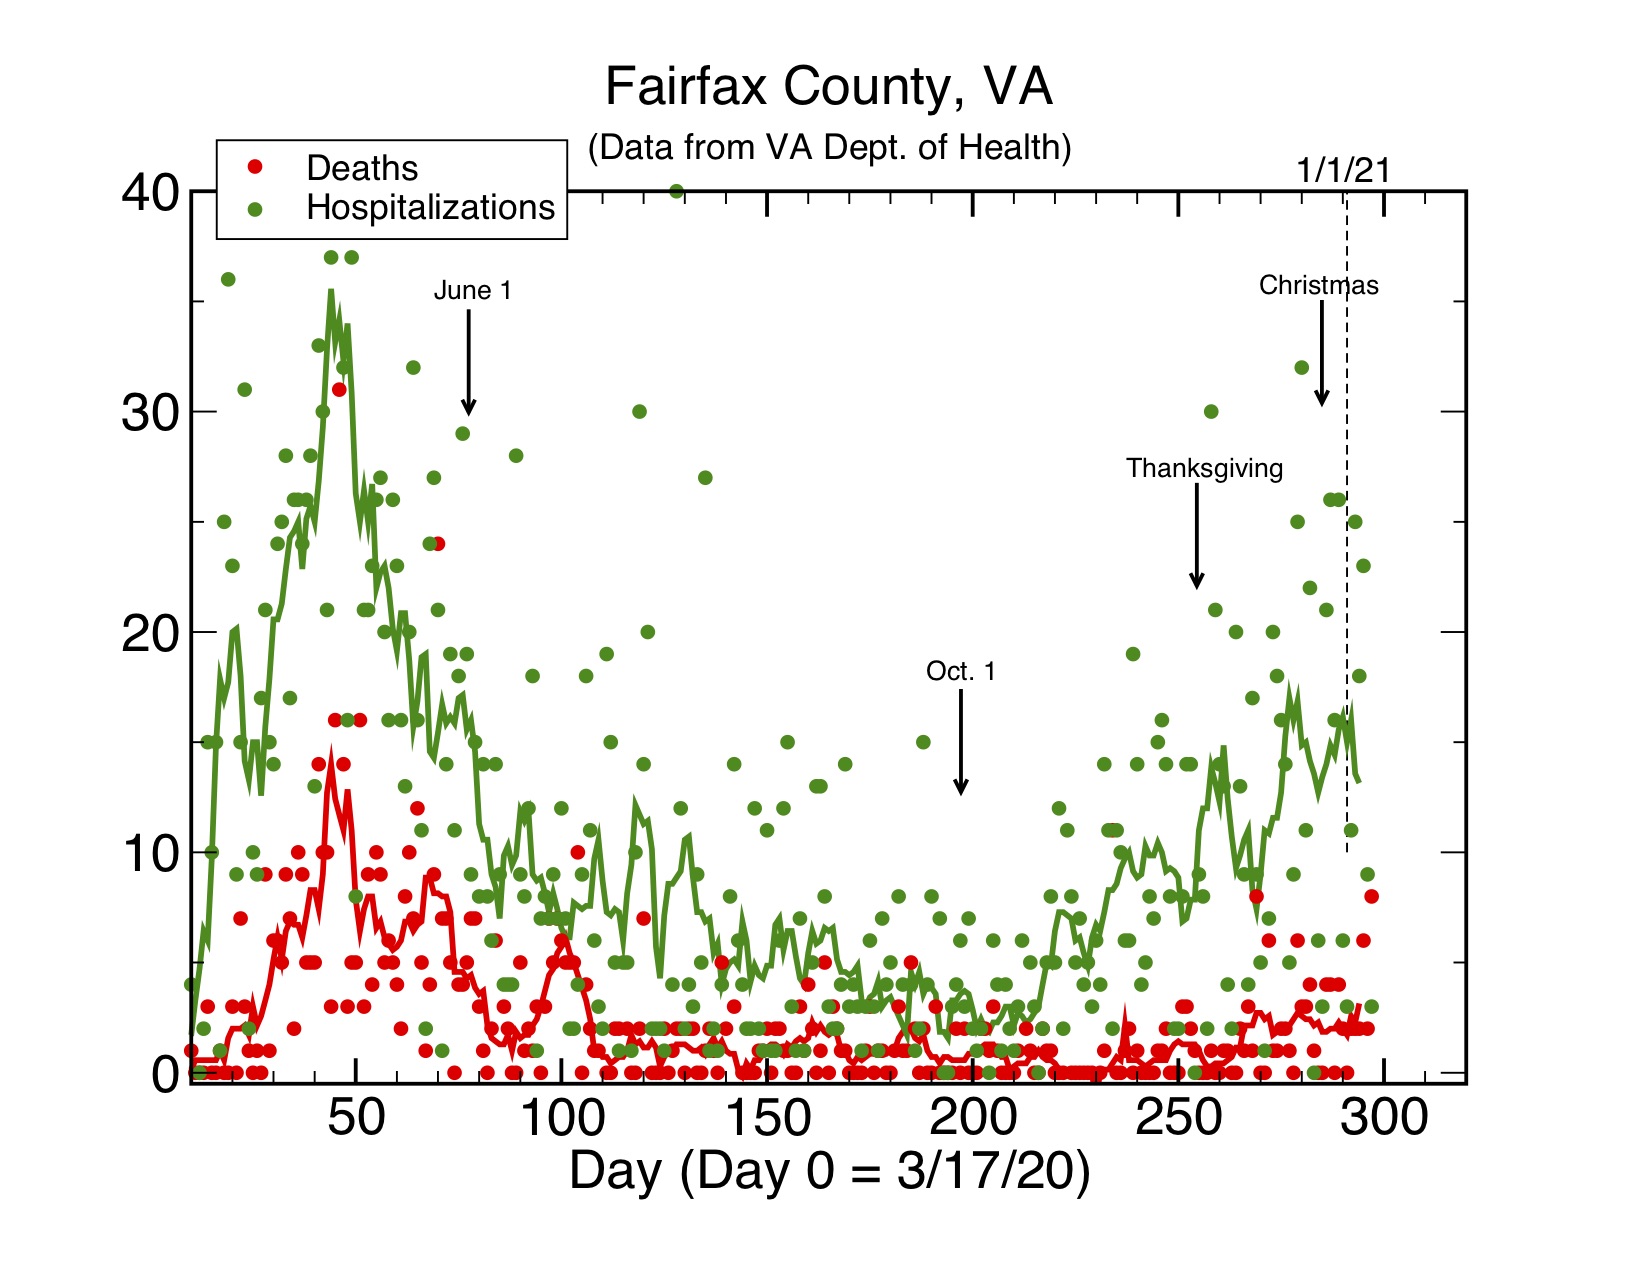
The good news is that the number of deaths (which determines the case fatality rate) has declined considerably from more than 10 per day at its peak in May to an 7-day average of much less than 1 per day in late summer and early fall. Unfortunately the data plotted here shows a much higher average of 2 or more deaths per day now–this is because of the increased number of cases. I consider it likely that the low number of deaths through the summer and early fall reflects both a low and stable total number of cases (testing was much better then than in the spring, so cases are counted better) and better care and treatment options than were available at first.

The third graph above plots the same hospitalization and death data as in the first two, but now as a ratio relative to cases (hospitalizations or deaths per day divided by the case number per day). By plotting the ratio for the per day numbers, you can see how the case fatality rate tracks over time. The more recent data should be more informative and accurate, since the number of cases are being counted more accurately now: testing in Fairfax is widespread and available, around 4000 tests per day, and the number of positive tests has remained low, ranging from around 15 per cent positive now to the few percent positive in the summer.
The hospitalization and death rates start out high in the spring but have consistently fallen, since, as explained above, the number of cases in the spring were most likely undercounted (thus the death rate per case is too high). The hospitalization rate stands now around 3 percent, or around 1 in 30 cases. The case death rate based on the daily data is now in the range of 0.5 percent, which is close to the best estimates from the Center for Disease Control (CDC) and the World Health Organization (WHO) from last July. Both the hospitalization and death rates are lower than the rates based on total cases, likely due to undercounting of cases by roughly a factor of 4 (see above) in the initial weeks of the pandemic.
Comparison to seasonal flu
Therefore, we can now compare the data for COVID-19 hospitalization and mortality to that of the familiar seasonal flu. I could not find all the data I need for Virginia or Fairfax. So I will use the CDC seasonal flu data for 2018 for the entire USA. Using rounded numbers because CDC reported a 10 percent uncertainty in them, there were 40 million total cases of seasonal flu in 2018, resulting in 530,000 hospitalizations and 49000 deaths. These data yield hospitalization and death case rates of 1.3 percent and 0.12 percent respectively. These are to be compared with current the Fairfax COVID-19 rates of 3 percent and 0.5 percent respectively. Thus, COVID-19 is approximately twice as likely to result in hospitalization and 4 times as likely to result in death per case than the seasonal flu. The good news is that the latter number is much smaller than I estimated last spring. Based on worldwide, USA, and Virginia data at that time, I had estimated that COVID-19 was 30 to 100 times as deadly as the seasonal flu (consistent with the early spring data from Fairfax and elsewhere). Now the best estimates are that it is only on the order of 4 to perhaps 10 times as deadly (depending on which numbers you use). This is also consistent with the CDC and WHO data, as well as the USA data on total cases and deaths, 23 million and 380,000 respectively, for a case death rate of 1.7 percent overall (while US deaths are counted accurately, total cases since last spring are undercounted, so the actual case death rate will be lower).
That the COVID case death rate is approximately 5 to 10 times that of the seasonal flu is consistent with the total numbers published so far: 380,000 COVID deaths from 23 million cases but only 49,000 flu deaths from 40 million cases in 2018 (do the arithmetic: (0.38/23)/(0.049/40) = 13, but remember that this number is a high estimate because of case undercounting, so my real-time recent factor of 5 estimate from Fairfax data and CDC/WHO is likely to be more accurate).
