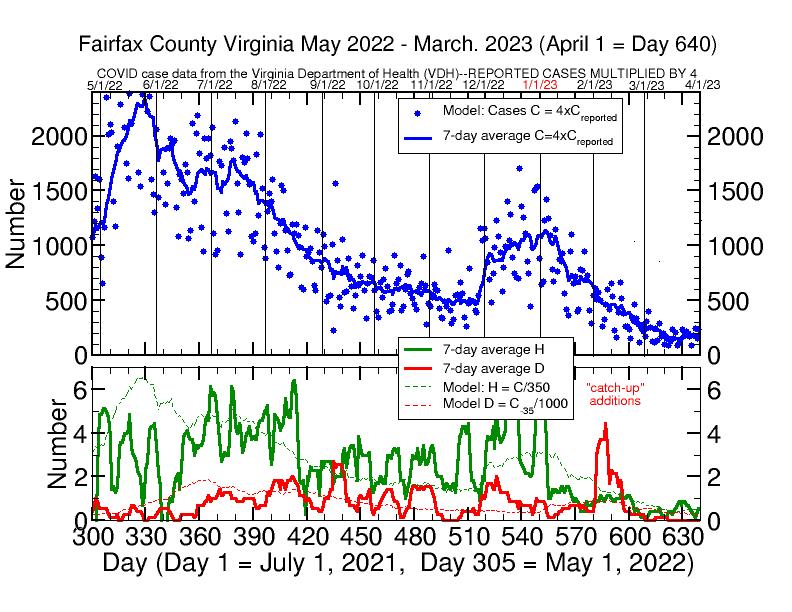
In the first quarter of 2023, January through March, Covid-19 continues to decrease in impact in Fairfax County, VA. The graph below tells the story. Cases have continued to fall through February to a new low in March, with about 45 to 50 new cases per day verified by PCR tests. The case rate is now remaining level, not decreasing. My model assumes that these undercount actual cases fourfold, so the actual number of new daily cases is likely around 200. Daily hospitalization and death rates, H and D respectively, remain quite low. My model of 1 H per every 350 cases C continues to hold, predicting around one new hospitalization every two days, in good agreement with VDH data. While my model of one death per every 1000 cases predicts that there should be 1 death approximately every 5 days, the actual death rate is actually much better: there has only been one death due to Covid-19 reported in Fairfax County in the entire month of March. Consequently, while Covid-19 continues to circulate here, its severity is greatly reduced from earlier in the pandemic and there are very few cases serious enough to require hospitalization.
Ironically, I have finally contracted Covid-19 for the first time in the pandemic. I tested positive 3 days after returning from an 8-day trip to Germany, where I had participated in a physics conference and in a university visit with collaborators. My symptoms remained very mild–primarily like a head cold with no fever or other symptoms–and after 5 days on Paxlovid the symptoms disappeared and I tested negative. But 5 days later the head cold symptoms reappeared and I tested positive again. It is what is known as a rebound case. I will update this page when I test negative again.