
Beginning of August, 2022
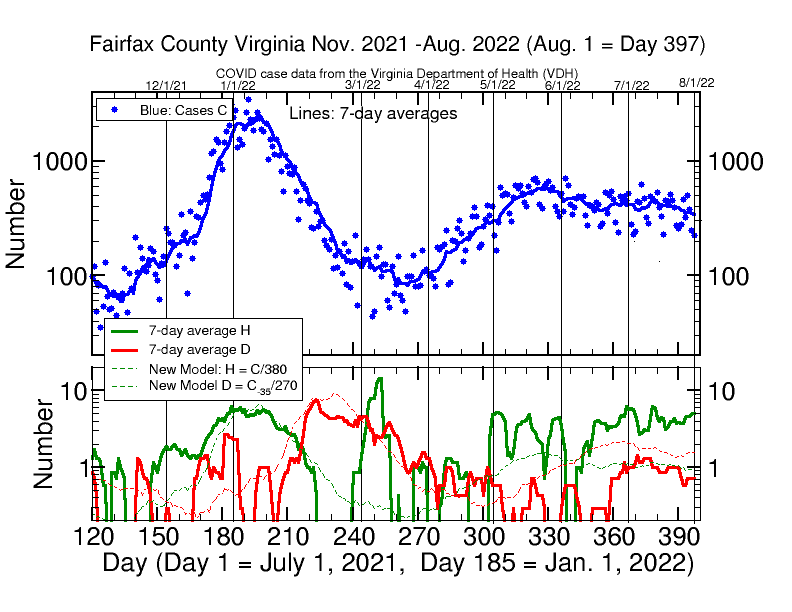
The graph below tells the recent story through the end of July 2022 (see also this link to see the “big picture” story from the beginning). The daily case rate (C) in Fairfax has remained relatively flat for nearly 3 months now in the range from around 300 to 600 per day, with only a slow decline from a peak 7-day average of 580 cases per day in May to around 350 cases per day at the end of July. Since Virginia only reports cases verified by a positive PCR test, the C rate represents an undercount because it leaves out all untested cases or those with only a positive at-home test. For the last 6 weeks or so, the daily hospitalization rate H has remained flat near 4 new hospitalizations per day and the death rate D has remained low at around 1 death per day (the actual numbers for the 31 days of July are 11905 reported cases, 116 hospitalizations, and 28 deaths, for daily average rates of C = 380, H = 3.7, and D = 0.90). My analysis of these data continues below.
Analysis
The first point is that cases seem to have stagnated at the relatively high level of hundreds per day, likely even more due to undercounting. The hospitalization rate tells an interesting story. The relatively flat recent H rate based on reported cases is around 1 in 100 cases, a much higher rate that the 1 in 380 cases during the Omicron surge last winter (it seems odd that the number of recent daily hospitalizations is similar to the number at the Omicron peak). My model based on 1 in 380 cases predicts we should now be having only around 1 hospitalization per day instead of 4. There are two explanations for this large discrepancy: first, the case number could be underreported by four-fold, or, second, the disease could be now more severe, resulting in more hospitalizations per case. But there is no independent evidence locally or nationally to support the second possibility that Covid has become more severe. Consequently, the best explanation is that there are roughly 4 times as many cases as are currently being measured by positive PCR tests. This underreporting plus a constant H rate of 1 in 380 cases, given H = 4 per day, would mean that there are now actually around 1500 cases per day in Fairfax County, most being unreported in the official count. This is an unprecedentedly high case rate, except during the Omicron surge. It suggests we are having a lot of cases of a very contagious but relatively mild disease. Please note that this is only a plausible interpretation of the data, not a firm conclusion.
This tentative conclusion that Covid-19 is becoming milder in impact is also supported by the data on daily deaths. Interestingly, actual deaths have remained even below the predicted number from my model based on a rate of 1 in 270 cases during the Omicron surge last winter. Currently the death rate D in Fairfax has been running at around 1 per day, slightly lower than my model prediction. The 28 deaths in 11500 reported cases in July corresponds to a death rate around 1 in 400 reported cases. But if the case rate is really closer to 1500 per day, the death rate would need to be adjusted to only around 1 in 1500 cases, which is even smaller than the death rate from the seasonal flu (1 in 1000 cases). Thus, we seem to be having a quite high case rate now with a relatively small death rate.
Demographics
Finally, it is worth looking at the C, H, and D data maintained by the VDH for different age groups. VDH breaks down the data sets for each health district into 9 age groups starting from 0-9 years old, 10-19 years, etc., up through 80+ years old. While the 80+ age group has the smallest number of cases of any group , namely only 3 percent of the total number of cases in the last 13 weeks = 3 months, this 80+ age group has had the majority of deaths. Nearly 80 percent of the Covid-19 deaths in Fairfax County over the last 3 months have been from the 80+ group. Fairfax County’s separate data compilation show 95 percent of the deaths over the same 3 months have come from the 65+ age group. Very, very few people under age 50 are dying of Covid-19 in Fairfax County. Furthermore, the hospitalization rate per capita–the H rate per 100,000 people age 80 and over–is by far the highest of any age group, even 4 times higher (per capita) in Fairfax County than for those in the 70-79 age group. It still remains dangerous to get Covid-19 if you are over age 80–the odds of dying are closer to 1 out of around 30 cases in this age group, compared to 1 out of 1500 cases for the overall population.
The basic conclusion is that it looks like Covid-19 may be becoming endemic in our population, that is, it will always be with us a some level. Current, the highly contagious variants in play are driving a large number of relatively mild cases in mostly younger people. For the most part, it is the oldest members of our population who end up in the hospital or dying. It is especially hazardous to have Covid-19 if one is over 80 years old. Virginia no longer reports data by vaccination status, but the latest CDC data show that vaccination is very effective in prevent serious illness or death, especially in our older population groups. Across all population groups, vaccination and boosting tends to improve the odds of avoiding either hospitalization or death by fivefold to tenfold.
