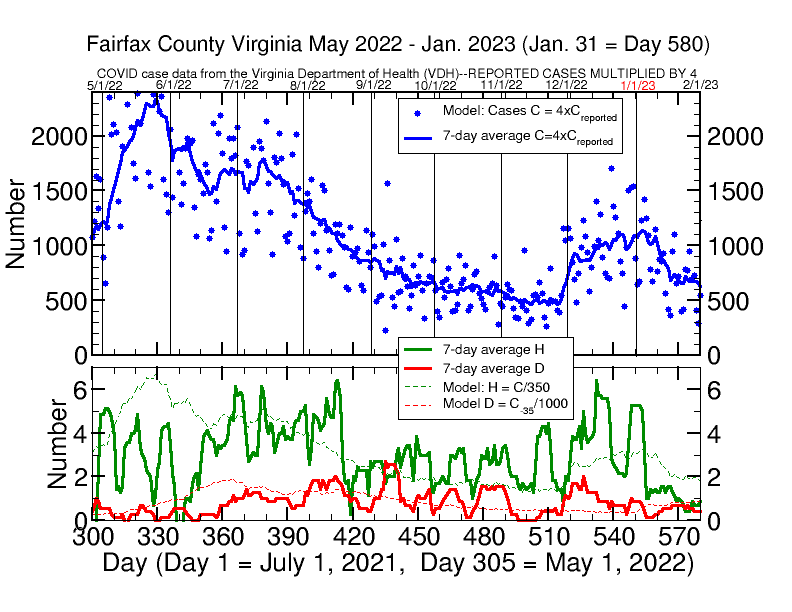
To update my Covid report for Fairfax County to February 2023, the graph below continues the story from last month. There has been no significant winter surge as some had predicted, although there was a doubling of cases from the week after Thanksgiving through early January. Cases are again falling. Given natural daily variations, my model continues to track daily hospitalizations H and deaths D relatively well. Both H and D remain low, both in fact and in the model. My model assumes that actual cases are 4 times reported cases (via PCR tests) and there is 1 hospitalization for every 350 cases and 1 death for every 1000 cases. The actual H rate in January was only around 1 per day, about half that predicted by the model. Virginia state data indicate that over 90 percent of Covid deaths are now among those 65 years old or older (mostly over 80), whereas most cases propagate among those under 65