
This update on Covid-19 data for Fairfax County covers over a full year from May 1, 2022, through May 31, 2023. Cases continue to drop since declining from the peak in May 2022 with a half-life of around 2 months until a doubling of cases in December 2022, followed by a decline with a half-life of around 1 month since the start of 2023 through April. Cases seem to be leveling off in May, with a slight increase followed by a slight decrease. There are only around 100 estimated cases per day in Fairfax now (to compensate for untested cases or home tests only, my model assumes the actual case rate is four times the reported number of positive PCR tests, now averaging around 25 per day). Daily hospitalizations and deaths continue to decline. My model assuming a hospitalization rate of one in every 350 cases remains fairly accurate on hospitalizations, predicting close to the current average reported rate of 1 new hospitalization every 3 days. While my model predicts a very low death rate of 1 every 14 days or so, trending downwards, the actual death rate is much lower than that: there was only one reported Covid death in Fairfax County in the entire month of March, only one in April, and none in May. Therefore, Covid is having a relatively negligible impact in Fairfax right now, consistent with the trend over the past few months.
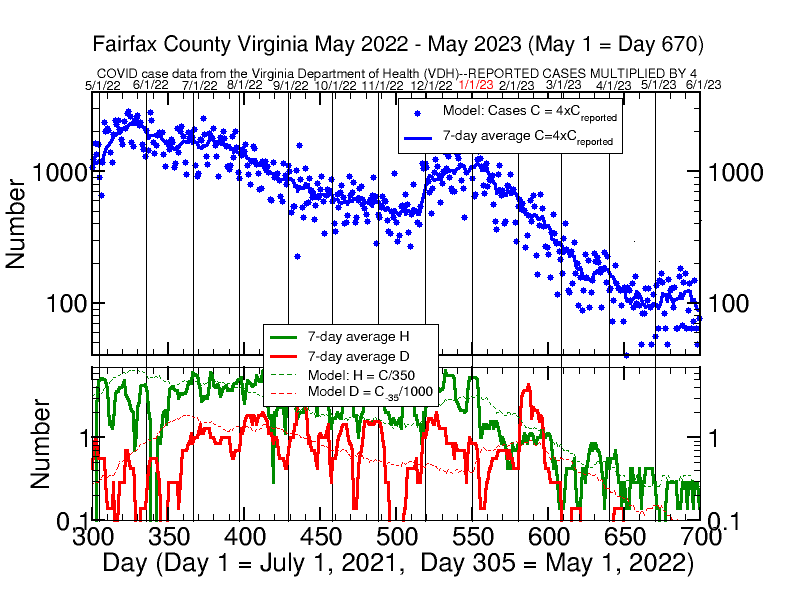
I plot the hospitalization and death data on a log plot so the small 7-day average values will show up. A value of less than one means that there is on average less than one event per day, averaged over a week. The dashed lines for the model predictions tend to track the reported data, given the wide range of daily statistical fluctuations for the small number of reported events, often none on a given day. The reported 7-day average death rate has remained zero for the last 8 weeks.
