
For the last year, I have been keeping track of the daily data from the Virginia Department of Health (DoH) on COVID-19 cases (C), hospitalizations (H), and deaths (D) in Fairfax County, where I live. Fairfax has a population of around 1.3 million and has had around 70,000 reported cases. Cases have varied from a few dozen to around a thousand a day at different times during the past year. The graph summarizes the data with some of my conclusions based on my own analysis. My point is to extract some generalizations that are robust, not to model fine details.
My model M is very simple (the formula is on the graph): I assume that cases were undercounted at first, by a factor of 5 at Day 50 (May 5, 2020) improving exponentially to being accurate around day 200 and after. With this model M of actual cases (top black dashed line), the hospitalization data (green line) are accounted for fairly well by assuming a constant hospitalization rate of 1 in every 33 actual cases. Similarly, the death data (red line) are explained by a death rate of around 1 in 200 actual cases, peaking 14 days after case onset. These H and D rates are consistent with similar values from other sources, with the H and D rates in Fairfax being on the low side of those from other parts of the USA or abroad.
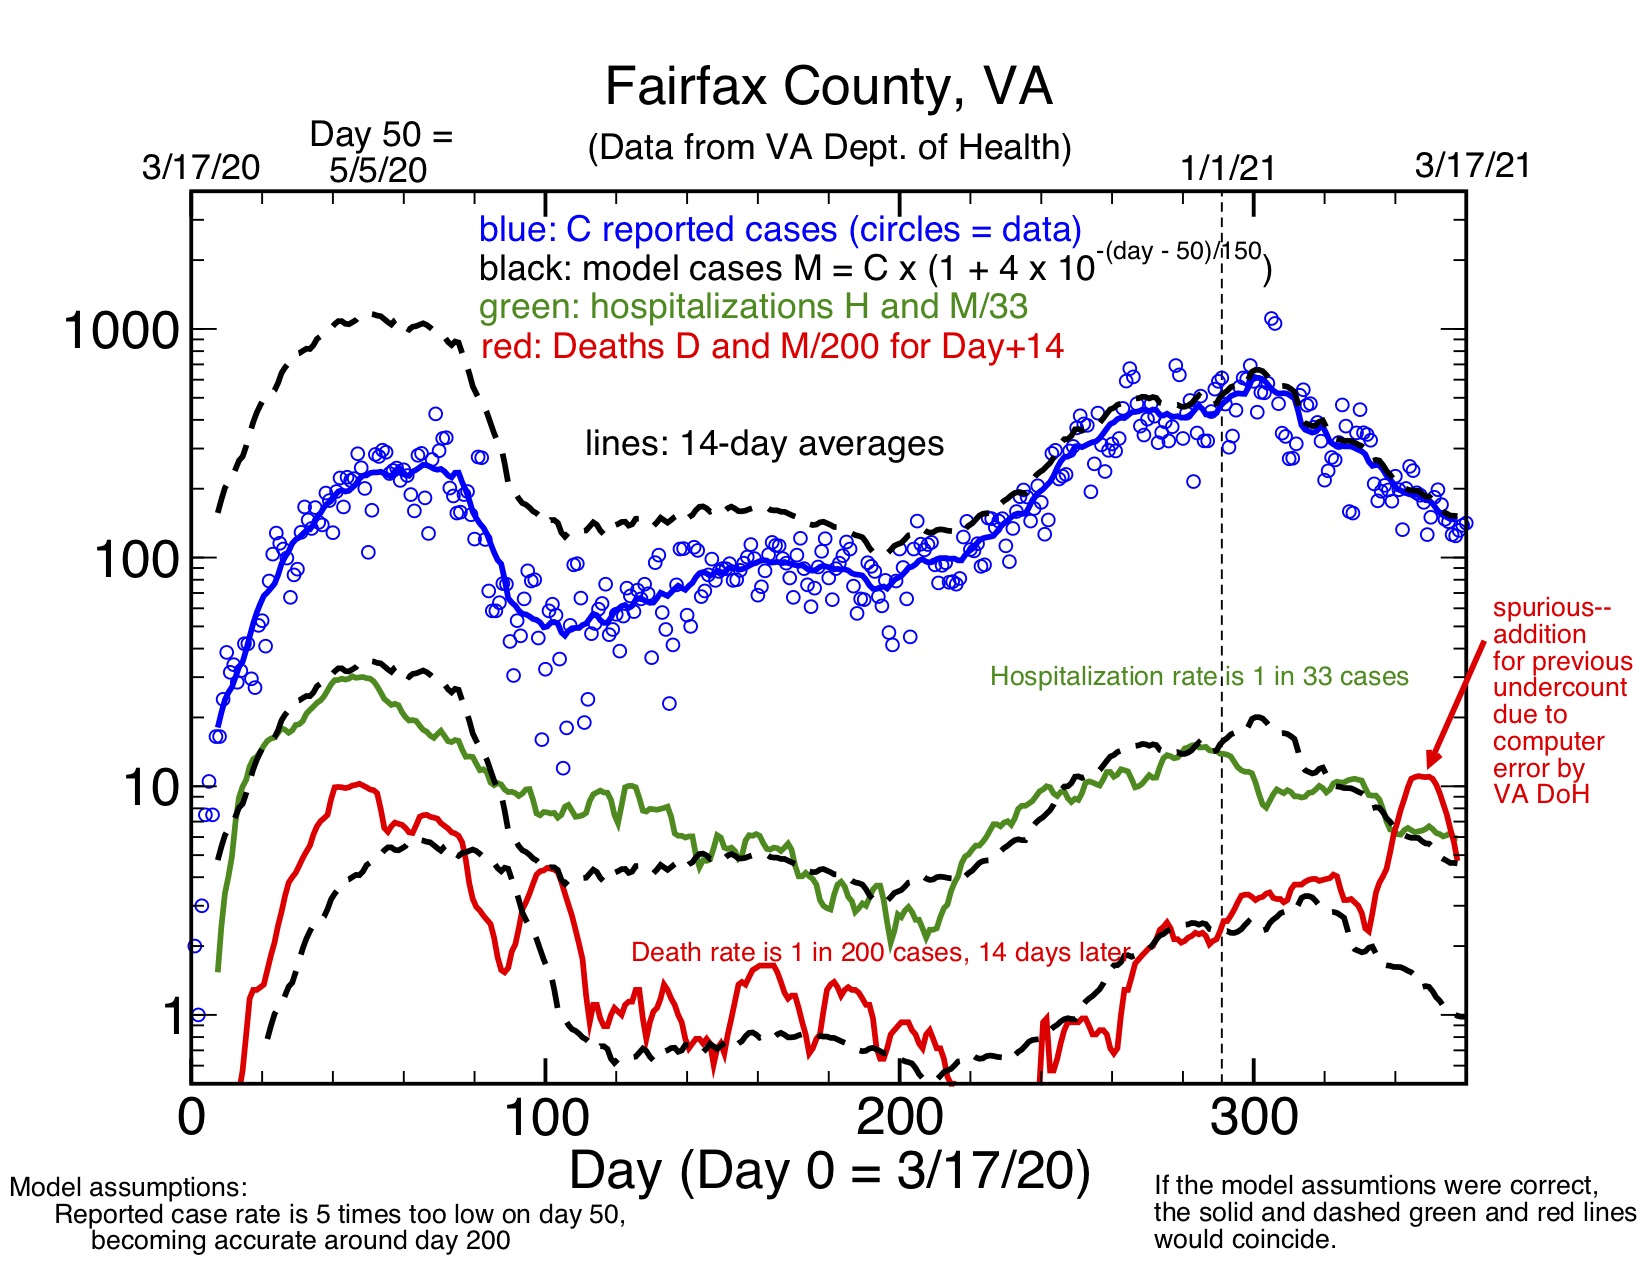
The solid lines on the graph show the actual data averaged over 14 days to even out statistical variation (points for individual days are shown for the case data, so you get a sense of the range of statistical variation). The dashed lines show my model predictions for C, H, and D, with the H and D lines derived from the M case numbers according to the formulas given. My model predicts that there were actually more daily cases in the (underreported) ramp-up last spring than in the more accurately counted recent spike this winter.
The model is not perfect, but not at all bad at tracking the trends and even the actual H and D data. Data from the earliest weeks of the pandemic may not be accurate. I also need to note that the VA DoH fixed a computer error that resulted in a spuriously large number of deaths being reported since around Feb 20 of this year as an error was corrected that caused underreporting of deaths after January 1, 2021. This caused a spike in D data beginning around day 340.
(Caveat: my estimates of the H and D rates will need to be modified if my assumption that testing had become accurate by around day 200 is not correct. These estimates would need to be corrected by the actual case data if there is a change).
