This is just an update of my post of March 19 which showed the data on COVID-19 cases in Fairfax County, VA, between March 2020 and March 2021. The new graph below updates the data through early last week. The news is quite good. You can see the steep decline in cases in Fairfax. It seems that, at least at the moment (June 13, 2021), that Covid has been essentially eliminated from Fairfax County (population 1.3 million). In the last 7 days, there have been nearly no cases reported for the first time in a year and 3 months (the data are “In the noise”, I would say; the 7-day average today is actually negative, reflecting the subtraction of cases from the state database; the 14-day average for Fairfax is only 4 new cases per day). The average of 1 hospitalization per day and only one death in the last 7 days likely reflects serious cases due to disease contracted earlier. Fairfax has a high vaccination rate, 60 percent of the total population with at least one shot, and 80 per cent of the population over 60 years old vaccinated. The data show the clear positive impact of vaccinations (as is true everywhere else where the vaccination rate is high).
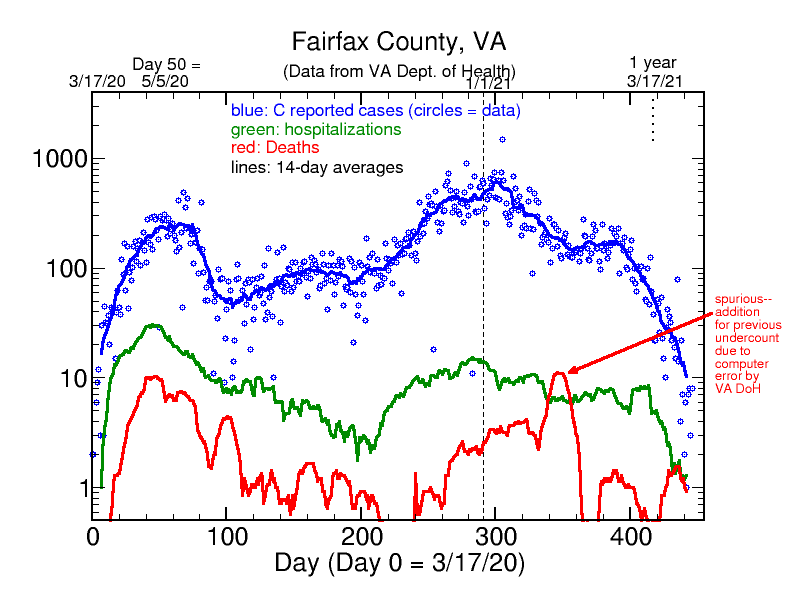
Actually Fairfax County is ahead of the State of Virginia as a whole, which reported a 7-day average daily rate of 143 cases today. This is a daily case rate of 1.7 per 100,000 people in VA, which is less than half that of the current case rate in the USA as a whole. Fairfax County is doing significantly better than the rest of the nation in this regard, and our population now is at very low risk of Covid with a 14-day average case rate of only 0.3 per 100,000, which is over 10 times better than the USA as a whole. As I read the data from a variety of sources, the message is: vaccinations work. Spread the good news. It would be really good for everyone if the unvaccinated fraction of the population would decrease to become sufficiently small so as not to be a continuing source of keeping this disease going.
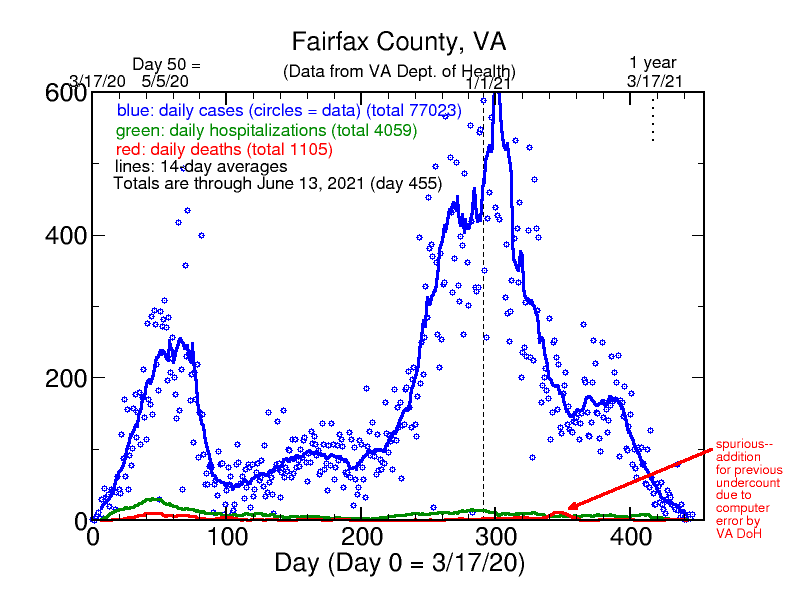
The graph below is the same but shows the data on a linear rather than a logarithmic plot, since some people might prefer a linear plot. I also added the Fairfax data for total numbers in the various categories. Cases early in the pandemic are undoubtedly undercounted, as the model in my March 19 post explained in some detail. Probably the overall undercount was around a factor of 2. So we may have actually had around 150,000 cases in Fairfax, along with 4049 known hospitalizations, and 1105 deaths. As the Fairfax County breakdown of the data by age group shows, 85 percent of the deaths (929) were for people over 65, although that age group only accounted for around 10 per cent (7877) of total reported cases. Thus, for Fairfax County, if you were over 65 and got Covid, your odds of dying were 1 in 8.5 (929 out of 7877). Nearly the same as in Russian roulette(!!), very dangerous. Even if there is an undercount in cases, the odds would be 1 in 17! There is a lot less dying if older people are vaccinated. That is what data here and everywhere else show. So if you have older relatives who are not yet vaccinated, please strongly encourage them to get one of them. It hardly matters which vaccine to get, since all are known to be good and effective in mitigating serious risk, including variants.