Where are we heading Nov. 30?
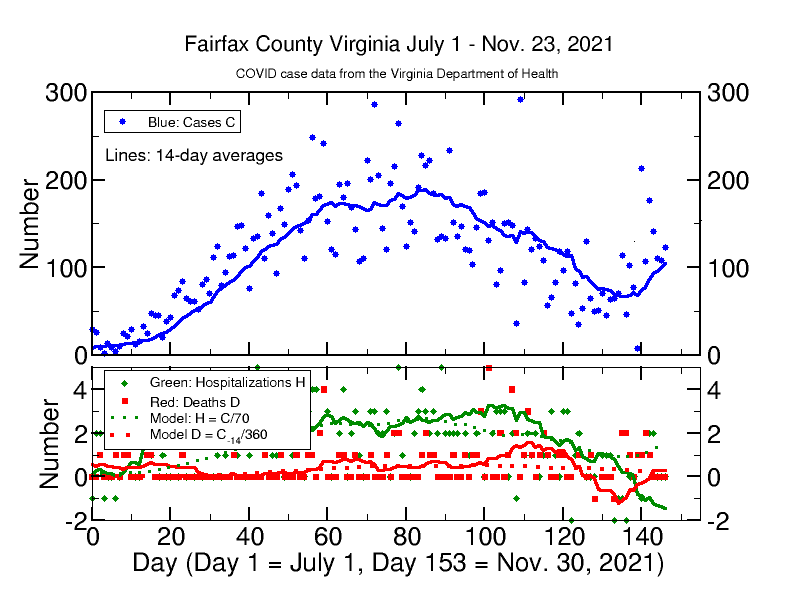
While cases C have been rising in Fairfax, the good news is that hospitalizations H and deaths D remain low. Fairfax continues to do better than Virginia and the USA as a whole on rates for C, H, and D. So the open question is: where are we heading now? Will it be like last year with a Thanksgiving and Christmas surge in C, H, and D? Or will we stabilize C with Fairfax’s mostly vaccinated population and keep H and D low? The graph shows the data from the VA Department of Health from July through the end of November. My comments are below the graph.
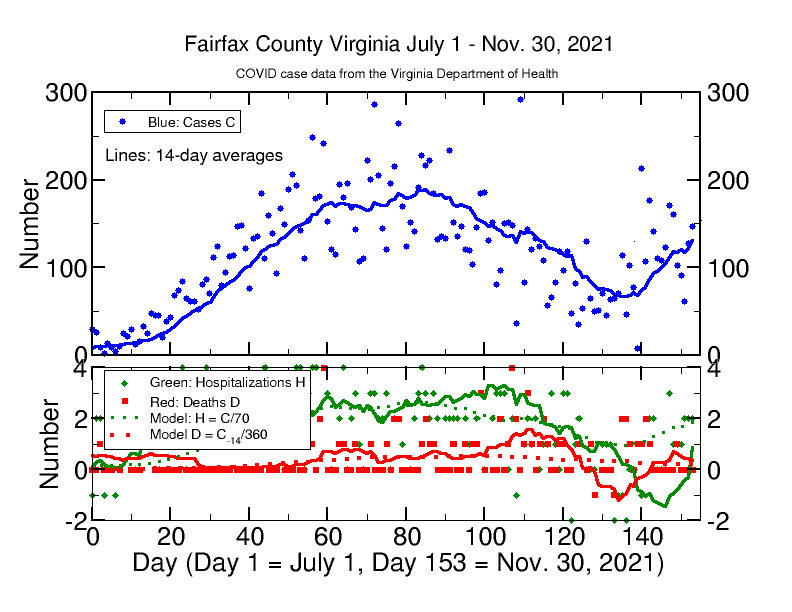
Since all C, H, and D data show daily statistical fluctuations, the solid lines show 14-day (2-week) averages, which smooth out the variations and show the overall trends better. It is clear that there was a turnaround in cases C in early November, when cases started to rise again. There appeared to be a brief slowdown over the weekend, but this may be related to less testing over the long holiday weekend; cases have picked up again over the past two days. Both H and D are recovering from their negative dip due to the prior removal of some H and D data by the VA Department of Health (VDH). Nonetheless, the current H and D data remain quite low and in the ballpark of my model predictions. In the last 7 days, VDH has reported 12 hospitalizations and only 1 death and in the previous 7 days, 4 hospitalizations and 4 deaths. The 14-day total of 16 H and 5 D represents pretty good concordance within statistical variation with my 14-day model predictions of 28 H and 3 D for the order of magnitude to expect given our case rate. As for the age distribution of cases, people 65 and older account for only 8 percent of cases, whereas 78 percent of cases are for people 49 and younger. All 5 deaths in the last 14 days were for people 65 and older.
The paragraph below shows how rates for C, H, and D are much better for Fairfax than elsewhere. Two other sections of this post below characterize the situation in Fairfax on Nov. 1, when cases were still falling, and again on Nov. 23, when cases had started rising.
Fairfax compared to Virginia and the USA
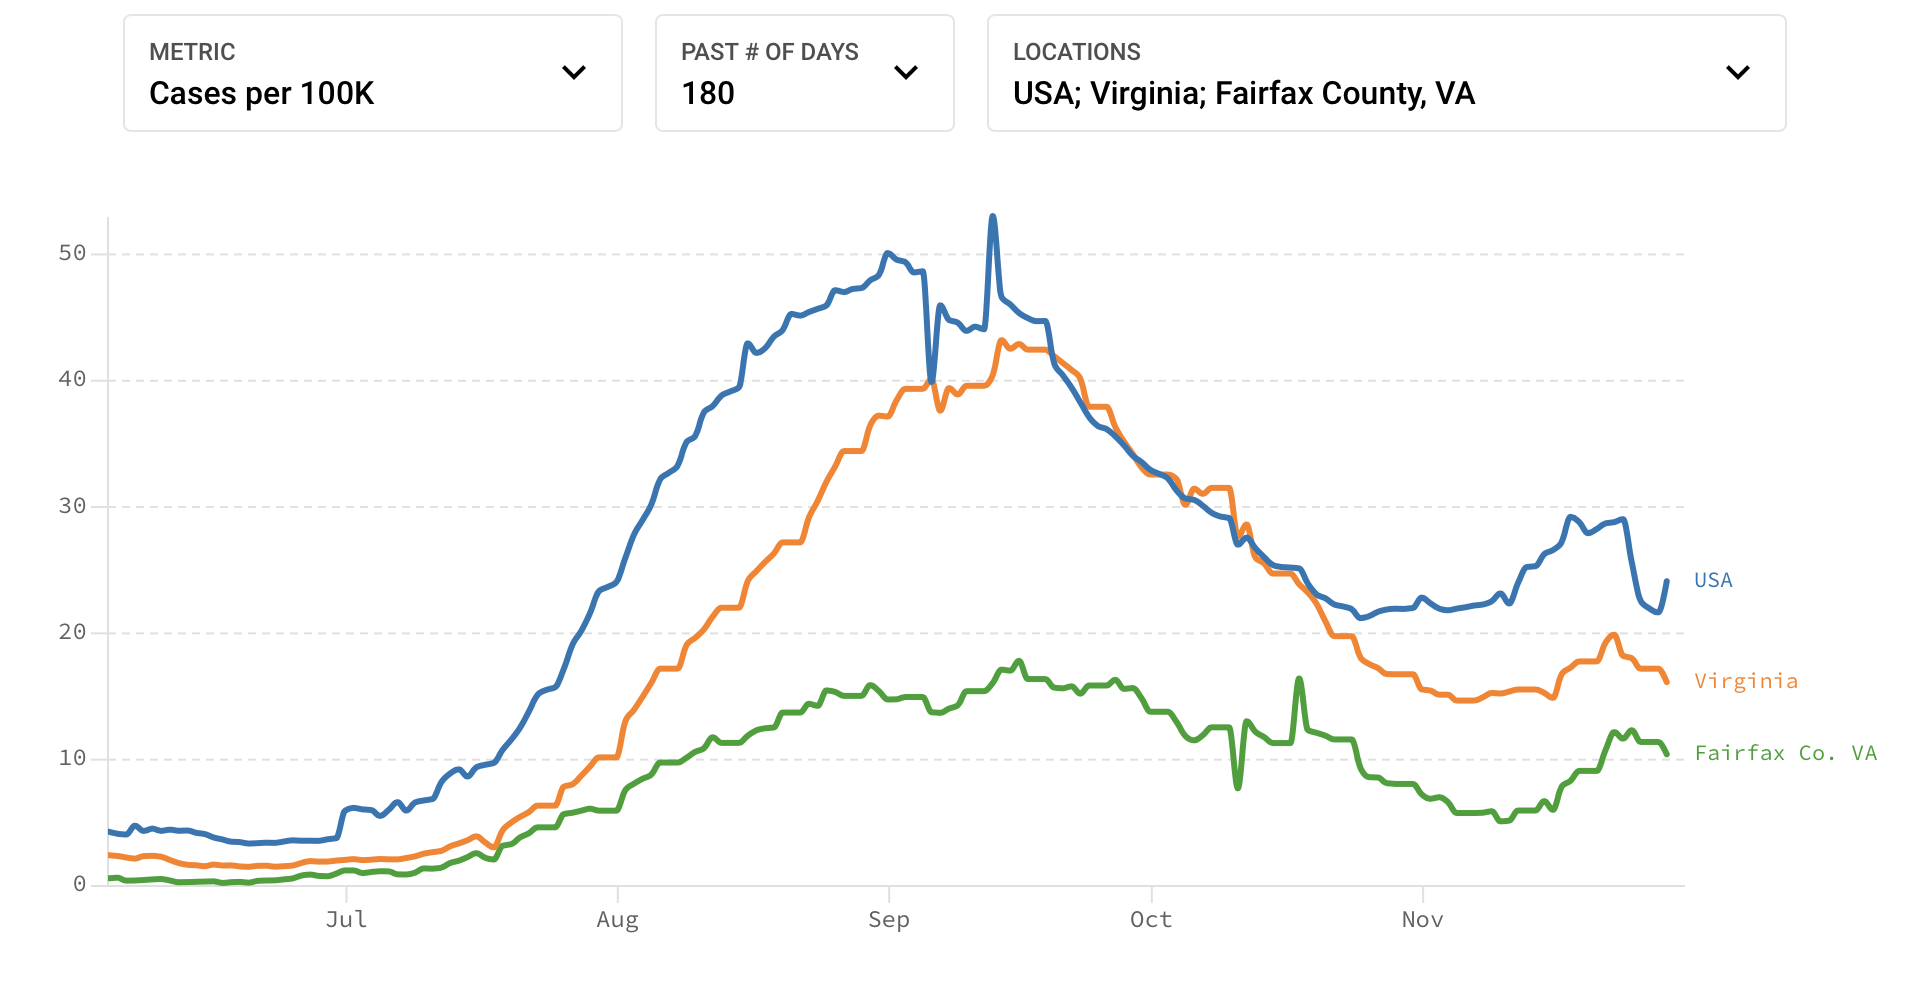
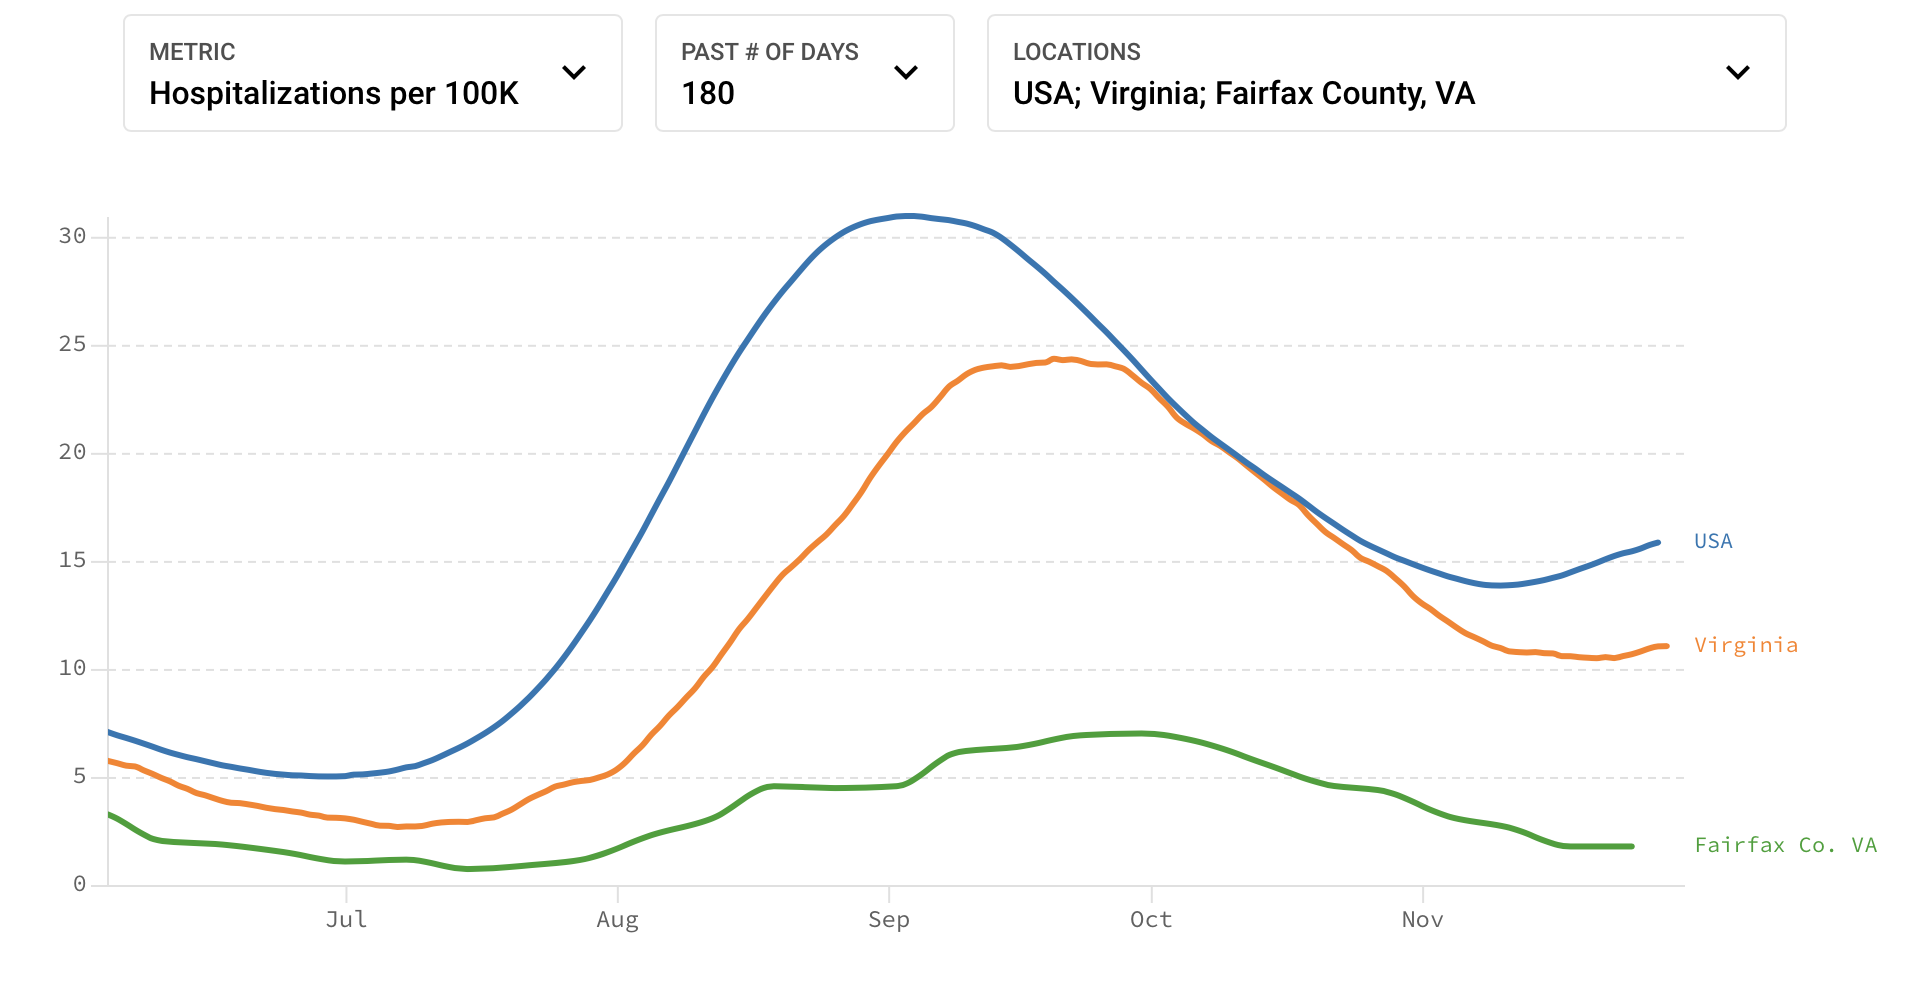
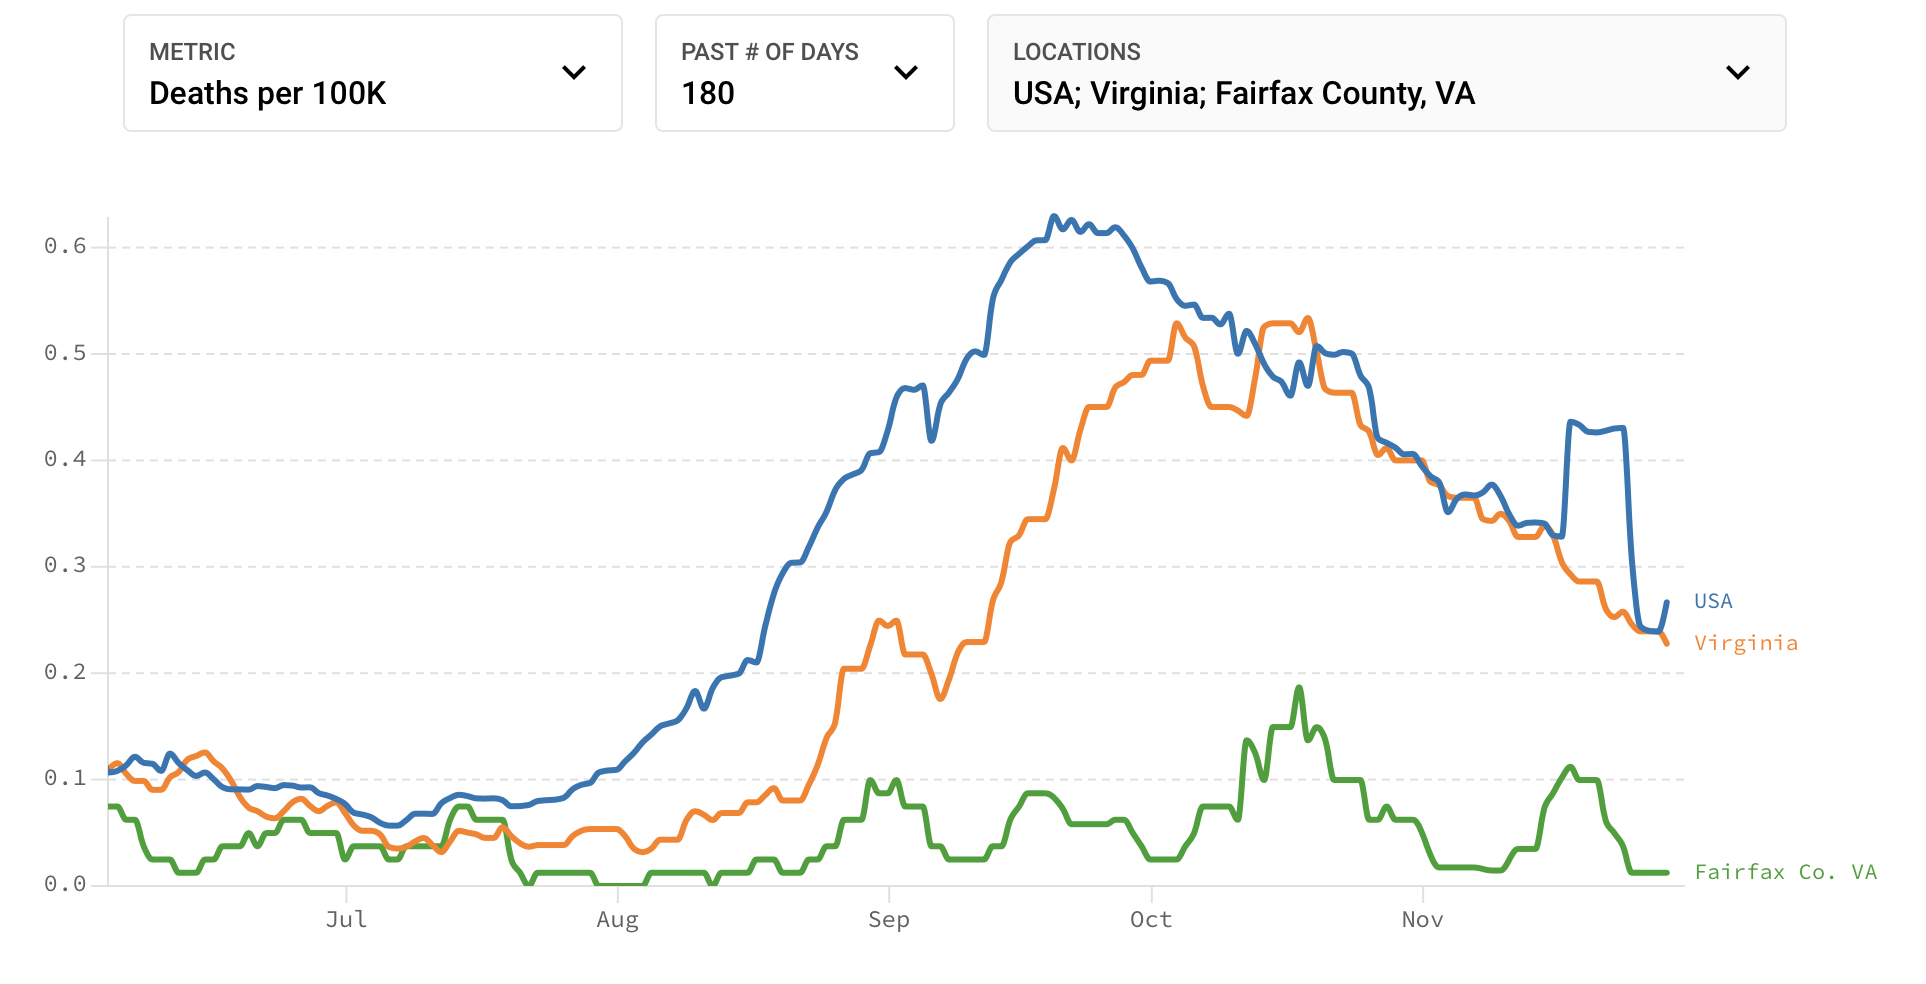
The graphs below compare per capita case, hospitalization, and death rates for Fairfax (green), Virginia (orange), and the entire USA (blue). Fairfax rates for all three are consistently low compared to the others. The current Fairfax rate for hospitalizations and deaths are both nearly 10 times smaller than for the USA as a whole and smaller than those for the State of Virginia. Source of graphs: Covid Act Now (see “Trends” and use the interactive graphics).
Report for Nov. 23: CASES ARE RISING AGAIN
The news is not so good this time, in contrast to my initial report for Nov. 1. Covid-19 cases are on the rise again in Fairfax, after falling steadily for the last two months. This parallels the situation elsewhere in Virginia and the USA as a whole. The sharp uptick in cases on the graph below is unmistakable. By contrast the numbers for daily hospitalizations (H) and deaths (D) have been falling, even becoming negative. The reason for the recent fall in the 14-day averages for H and D is clearly not a recent rash of resurrections in Fairfax. Rather, the County and State have been removing some previously tabulated H and D cases, resulting in negative values for either on certain days (there is no information as to which days the removed cases originally belonged to). The County and State removals have not been totally consistent in specific numbers, but the overall effect is similar. Fortunately, there are relatively few new hospitalizations and deaths, 9 H and 4 D in the last 7 days giving low rates that are roughly consistent with my simple model.
We do not know where this will be going. Will we have a rapid rise with many more deaths to come before next spring? Or will it level off and remain significantly contained? Overall, Covid is a mystery to predict accurately, and often baffles the experts. One thing is sure: most of the deaths have been and still are among the older generation over 65. All of the 10 deaths in Fairfax over the last 12 days have been for those over 65, as have 82 percent of the 1225 deaths in Fairfax over the whole pandemic. In consrast, most of the cases, 92 percent of those in the last week in Fairfax, is among younger people under 65; 32 percent of the cases were in those under 18. Children rarely get very sick from Covid, whereas most of those hospitalized with serious cases (and many of those die) are for people over 65, even vaccinated ones. Disease spreads primarily because of the unvaccinated, of which there are around 400,000 people in Fairfax county who are not fully vaccinated (and 300,000 not vaccinated at all). Younger people rarely die of Covid, especially if they are vaccinated, and any seriously harmful side effects of the vaccine are vastly less probable that the known and common dangerous side effects of the disease. This is a prime reason for ALL people, especially the younger, should be vaccinated, to prevent the SPREAD of the disease, which disproportionately kills the elderly and causes long-term harm to many younger people too. That is why we need maximum vaccinations to get closer to herd immunity–to prevent the continuing spread of the disease. Spreading poses two major risks: (1) giving rise to new and more dangerous mutations, and (2) definitely will result in the needless and preventable death of many of our older citizens and the suffering of many others.
The following may be a strong and controversial viewpoint, but it needs to be said nonetheless. I consider it to be fundamentally immoral for an adult NOT TO GET VACCINATED when vaccines are readily available, and, of course, if one does not have a valid medical reason why vaccination would be harmful to oneself (the latter offers a case where not being vaccinated makes good sense and is not wrong). It strikes me as decidedly odd when Christians oppose vaccines, since not to get vaccinated seems diametrically opposed to Jesus’ clear commandment to love one’s neighbor. Love of neighbor requires that I do what I can to minimize the spread of disease and to prevent the cause of needless suffering and death of others. From my perspective as a scientist who has tried to keep abreast of the documented science of this pandemic, vaccine opposition primarily derives from scientifically disprovable misinformation, which all too readily circulates among those who allow themselves to be misinformed. Given the high scientifically-demonstrated effectiveness and lack of any significant level of dangerous side effects of the vaccines (too many misconceptions abound), simple compassion for those among us who might suffer from this most destructive disease compels taking steps to mitigate or prevent such suffering if one can. There are too many tragic stories told by hard-laboring medical personnel about unvaccinated patients whom they see suffering and dying needlessly because such patients allowed themselves to be deceived about this malicious disease. Fortunately, almost everyone I know is vaccinated, but there are still too many who are not, even in Fairfax. I don’t want that latter fact to cause harm my family, or yours.
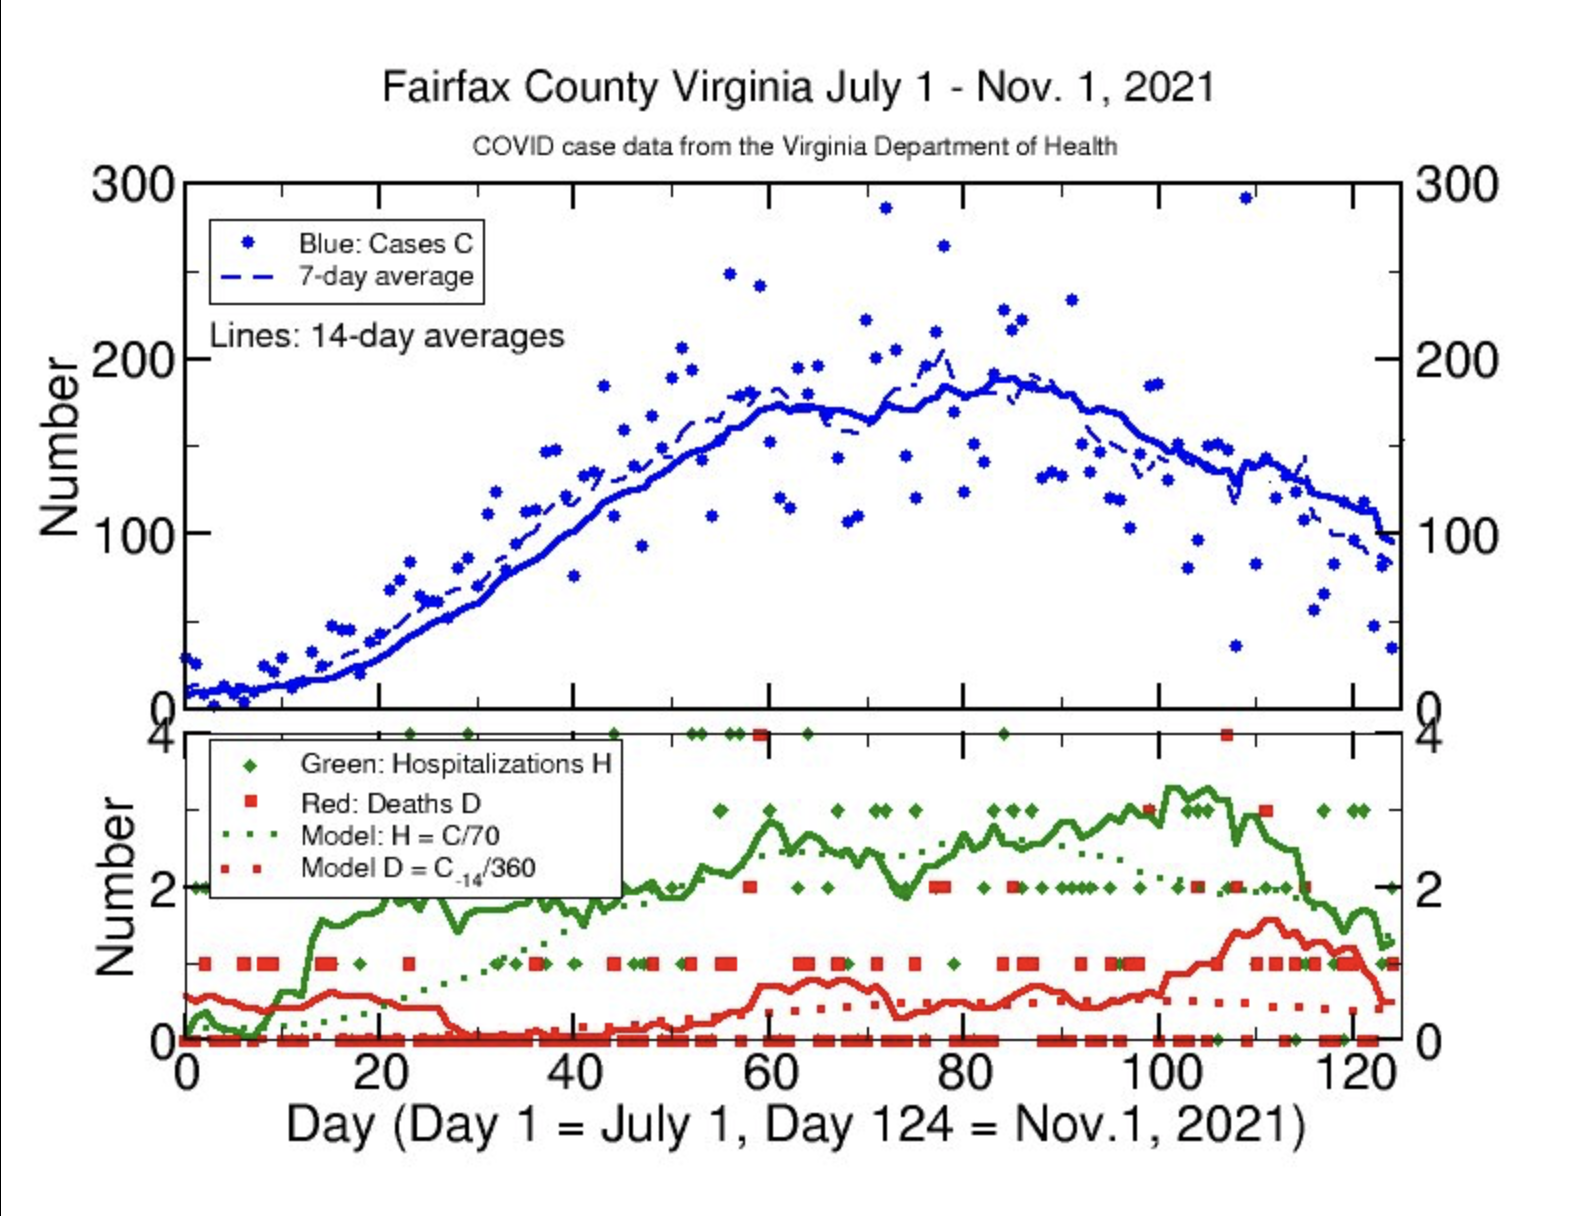
Initial report for Nov. 1
Now that the data for all of October is available for Fairfax, my Covid update continues to be good news. Cases continue to fall, with the 7-day average now around 84 (slightly less than the 14-day average). While there had been an increase in hospitalizations and deaths starting a few weeks ago, the last week or two has seen a clear downturn in these such that the current values are back in line with my new model predictions. Probably the increase was due to lingering cases from the peak of the surge in late September. Fairfax continues to be better than national rates on all counts.
If Fairfax could reach a case level around 10 per day or less or 1 per 100,000 population, we could say the pandemic is essentially over here, with very little risk to normal activities. The risk is still high enough to warrant precautions, especially for older people with underlying conditions that increase the risk of serious illness. In the last 2 weeks, 11 percent of the cases, but 90 percent of the deaths, have been in people over 65. The disease hits older people hardest. While Fairfax does not publish data on the vaccination status of those who died, state and national data show that it is highly likely that most of those who died here were unvaccinated. Vaccination is known to protect against the severity of the disease in all age groups. Overall there is a 5- to 6-fold decrease in the per capita numbers of cases, hospitalizations, and deaths for fully vaccinated people compared to unvaccinated ones.