
Report on the whole pandemic as of December 16, 2021
Update Dec. 17: Omicron warning (see below)
Now we are mid-December and time for an update on the Covid situation in Fairfax County. This time, instead of only showing the data since July 1, I produced a graph for all 640 days for which data is available for Fairfax. This lets you see several significant trends in the “big picture,” which I will discuss below. On all measures throughout the pandemic, Fairfax has done better per capita than most other parts of the USA. Currently, we have a lower per capita daily case rate (18 per 100,000) than the USA as a whole (36 per 100,000). The daily per capita death rate is over 10 times better than for the USA as a whole (0.037 versus 0.39 daily deaths per 100,000). If the USA had the same per capita Covid death rate as Fairfax, there would only be around 120 Covid deaths per day in the whole USA now instead of the actual 1200 death per day. That is a big difference: Fairfax is now having around 1 Covid death every 3 days, whereas it would be having around 4 per day if it had the USA rate (with populations of 1.15 and 334 million respectively, Fairfax has 1/290 of the USA population).
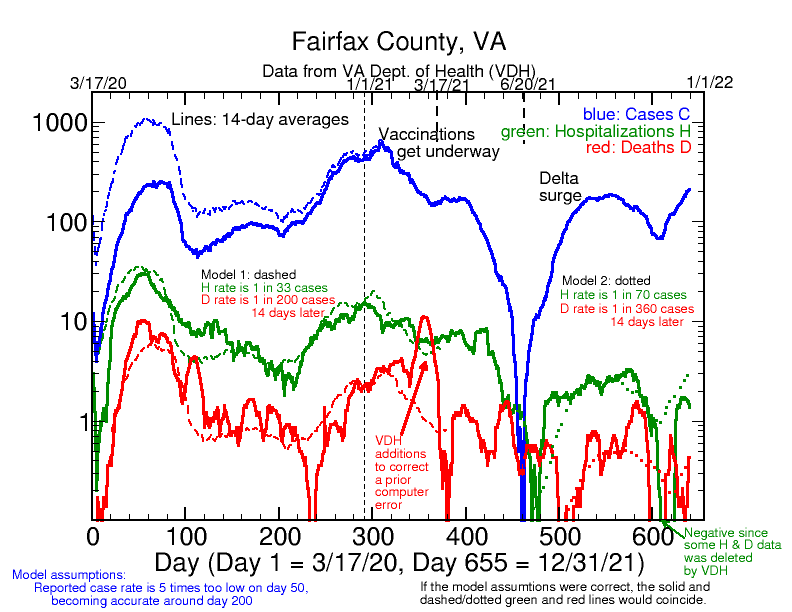
My numerical models are based on reported case data from VDH and the assumption of a fixed ratio of H or D to cases (the latter for cases 14 days previous, since that is about the interval between onset and death). In the first year of the pandemic, there was one H for every 33 cases and one D for every 200 cases. These ratios give a good account of the data prior to vaccinations. There has been a big improvement in the last 6 months. The ratios now needed to account for the VDH data are one H for every 70 cases and one D for every 360 cases. Data over the last month or so suggest that even these revised ratios are not optimistic enough, since they tend to overestimate H and D in recent weeks. All this is good news for Fairfax County.
Several trends are clear from the graph. First of all, there have been 3 “waves” of the pandemic in Fairfax County. The first was the initial ramp-up in the spring of 2020, the second was the winter of 2020-2021, and the third was the “Delta” wave coming in the summer of 2021. We may be starting into a 4th for the winter of 2021-2022; time will tell, but Fairfax cases are currently ramping up with a 3-week doubling rate, and the omicron variant may make that much faster once it hits here. The all-pandemic graph shows that all measures (C, H, and D) have all consistently dropped in peak values in successive waves. For example, the peak daily new cases were around 1000, 500, and 190 respectively in the 1st, 2nd, and 3rd “waves.” Thus, the 2021 “Delta wave” was much less severe than was the initial ramp-up in 2020. Furthermore, the number of people being hospitalized or dying has dropped in successive waves and is quite low now. We are running about 2 new hospitalizations per day in Fairfax and have only about one death every 3 days or so—this value fluctuates due to statistical variation since so few people are dying here now (the County has only reported 9 new deaths in the 26 days since Nov. 19).
As for the age distribution of the disease, in the 77 days since Oct. 1, 2021, 75 percent of the 10671 cases in Fairfax have been in the age group under 50 and only 25 percent in the age group 50 and older; 28 percent were for those under age 18 and 9 percent were for those 65 and older. However, the distribution of deaths is inverted from the case distribution, with the oldest people being by far at greater risk. Of the 54 deaths since Oct. 1, 48 of them, or 89 percent, have been in those 65 or older, none have been for anyone under 18, and only 1, or 2 percent, in the 18-50 age range. Thus, as far as Covid in Fairfax County goes, there is very little risk of death for anyone under age 50, but still a serious risk of death for those over age 65 who get Covid. In the USA as a whole during the nearly 2-year course of this pandemic 1 out of every 100 Americans aged 65 and older has already died of Covid. The number is similar for Fairfax County, of our 154,000 inhabitants 65 and older, 1009 have already died of Covid, which works out to be 1 in every 153 people 65 and older in the County. In the past year, Covid has joined heart disease and cancer as one of the three leading causes of death for those over 65 in America.
Fairfax does not break down its data by vaccination status, but the State of Virginia does. Since Jan. 17, 2021, the unvaccinated in Virginia have had 4.3 times as many cases as those fully vaccinated; looking at the data for early December, the ratio has become better for the vaccinated, who now are having 9.5 times fewer cases than the unvaccinated. The conclusion is clear: most of those dying are those over 65 who are unvaccinated (since by far the most cases are among the unvaccinated), whereas the continuing propagation and spread of the disease is due to those under age 50 who are unvaccinated. Most of the cases are for those under 50, and most of the cases are among the unvaccinated. The under-50 age group is the least vaccinated in Virginia as a whole, although the vaccination rate for those between 18 and 50 is high, around 70 percent. Around 96 percent of those 65 and over are vaccinated in Virginia; surprisingly, it drops to 86 percent for those 85 and over. The vaccination rate is lowest for the age 5-11 group where it is only 27 percent of children in that group, but it is 69 percent for those 12-17. The under 18 age group accounts for 28 percent of cases in Fairfax, and the 18-49 age group for over half, 52 percent, of cases. The disease primarily propagates among younger people but primarily kills older people. This is the main reason for younger people being vaccinated: to slow or stop the propagation of the disease so it does not kill their parents or grandparents. The logic is quite simple.
CORONAVIRUS OMICRON WARNING
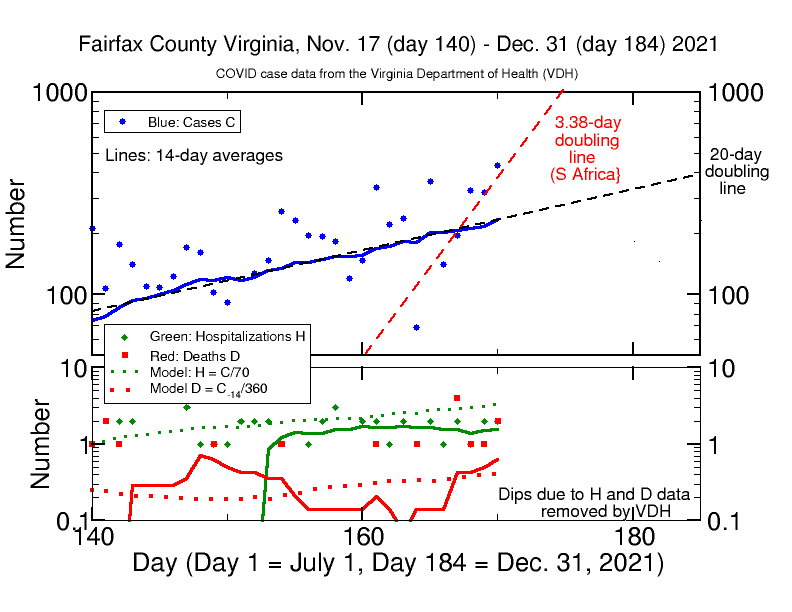
As a followup to my optimistic report above on the overall Coronavirus pandemic let me add a warning about the new Omicron variant, which is expected to start ramping up here soon. The graph below shows cases, hospitalizations, and deaths on a log scale, where exponential doubling shows up as a straight line. The graph spans VDH data and my models from Nov. 17 through the end of the year. The Fairfax case data for the last several weeks has clearly been on a 20-day (3-week) doubling trend (the dashed curve cleanly follows the averaged data solid blue line). It is believed that the new Omicron variant, which has not hit here yet but surely will, is highly contagious (and might be significantly contagious for vaccinated people). A doubling rate of only 3.38 days was measured for the ramp-up rate of Omicron in a South African province, according to a paper on the Medical Archive that has been submitted to be published in a medical journal. This is about twice the 7-day initial exponential ramp-up rate seen in Fairfax for the Delta variant in July. I put a hypothetical red dashed line on the graph showing how fast cases would ramp up if we had a 3.38 doubling rate here. Oddly, the rate matches the Fairfax data for the last 5 days, although I would NOT take this seriously, since it is more likely that the variation over the last 5 days can be explained by normal statistical fluctuations. But let this be a warning to keep our eyes peeled and start to take serious precautions (masking in public, distancing, hand-washing, avoiding unmasked indoor events) if a statistically valid rise this fast should begin. We have already put into place such precautions.
Data for the UK reported in The Economist indicate a faster than 2-day doubling time for Omicron (from 32 to over 10000 cases in 2 weeks). This is on a par with the initial 2-day doubling exponential ramp-up rates in New York City in the early part of 2020. There are reports of Omicron ramp up in the USA with 2- to 4-day doubling times, consistent with the South African data. One significant concern with a fast ramp-up in cases is that the hospital and health care system becomes overwhelmed with Covid cases, thus denying adequate care to all and preventing ordinary care for people with other health issues. This has happened for many places in the past when Covid cases overwhelm the system. Furthermore, our overstretched healthcare workers experience exhaustion and burnout.
There are some very concerning data in the last few days from Fairfax. Today, VDH reported 436 confirmed cases in Fairfax County, the most cases in a single day for the last 10 months (!!!), since we had 478 cases on Feb. 10, 2021. While it is good that hospitalizations remain fairly constant near 2 per day, slightly below my model prediction, the County has reported 8 new deaths in the last 4 days alone and 9 in the last week. This is after a three-week period in which only 3 deaths total had been reported, or 1 per week. One other disturbing aspect of the deaths during the last 4 days is that two people under age 50 have died, including one posted today. Prior to that, we had gone over two months since someone under age 50 had died of Covid in Fairfax County. Only time will tell whether these recent deaths reflect a statistical fluke or are part of a longer trend.
If there is one piece of good news about the new Omicron variant, it is that it seems to be no more serious than earlier variants and may be measurably less so (the data are not clear yet). It also seems that fully vaccinated people still get protection from serious illness and death from the Omicron variant, especially if they have had a third booster shot; however, there is less protection than for earlier variants against getting the disease in the first place. This all seems consistent with a news article today in Nature about Omicron. So the case rate is not the only story. There also remains the possibility that this Coronavirus will ultimately become endemic and more like a serious common cold and more like the seasonal flu that has long been with us. Meanwhile, avoid it if you can, for long-covid and other side effects make this virus something you do not want to get if you can help it.
I know everyone is sick and tired of Covid and the restrictions it puts on our lives. I am too. But if we wish to minimize the effect on our society and our individual lives, we had best respect the facts of the matter. Viruses evolve and will do what they do to infect us, whether we like it or not. So it is best to be prepared and keep track of the best medical/scientific information we can about the disease and how to avoid it or mitigate its effects. One can’t make this dangerous virus go away by ignoring it. Far too many people have already died because they unwisely ignored the counsel of medical science and then it was too late for them.
