
Data in the graphs is through July 31, 2021; text is for July 26, 2021, with subsequent days Addenda at the end. See especially the Addendum for July 31.
(July 26, 2021) Here is an update on COVID-19 in Fairfax County Virginia based on my continuing monitoring and analysis of daily case data from the Virginia Department of Health. The bottom line: I had thought the pandemic might be over in mid-June when the County case rate kept dropping and had bottomed out at an average of around 3 to 5 cases per day around day 40; however, cases over the last 4 weeks have risen rapidly with an alarming doubling period of only 7 days, giving rise to a nearly 20-fold increase in cases in the last month (see model below). Fortunately, so far, hospitalization and death rates remain relatively low (a few and less than 1 per day respectively), with no evidence of exponential increase yet, although these lag cases so that I expect them to increase in the coming weeks.
The graph clearly shows the sharp increase in cases beginning in late June (around day 60). The increase in the data is represented by a simple exponential growth model I developed to analyze it: the model assumes a constant “background” rate of 3 cases per day from late June and an exponential doubling time. The model with a 7-day doubling time fits the data from the last 4 weeks very well; 5-day doubling is too fast and 9-day is too slow (see graph). If such rapid weekly doubling should continue through August, Fairfax will be having over 1000 cases a day by the time school starts–a case rate higher than at any time in the previous year!! We would then be in the midst of a full-fledged pandemic again. Of course, my model is only a mathematical model, and something usually intervenes to stop such exponential growth (for example, many people start taking extra protective measures when they realize what is happening). But significantly increased case rates may be likely in our future. The next few weeks will tell.
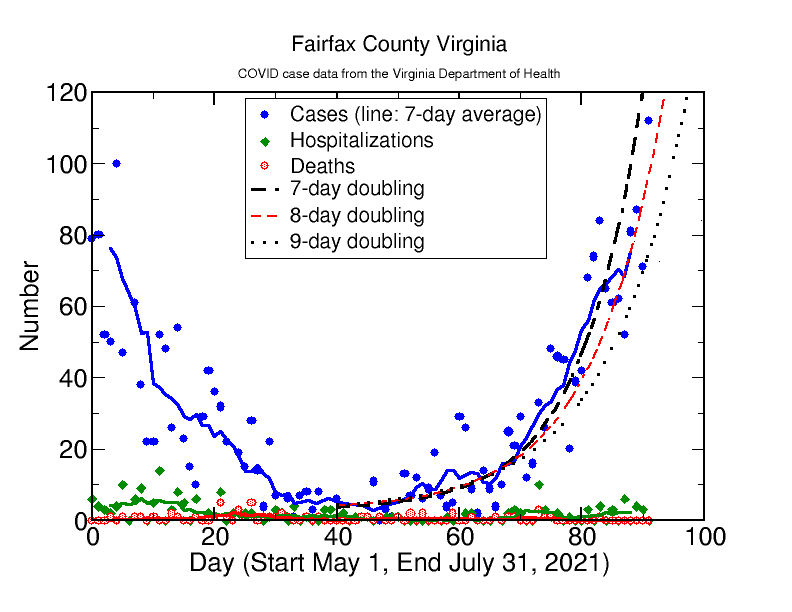
This is something to watch closely and begin to take extra precautions now–we are again in a very dangerous phase in spite of vaccinations, of which Fairfax has a high rate of over 75 percent of adults over age 18 (and 64 percent overall). Presumably, most of the new cases here are among the remaining unvaccinated population, as in the rest of the country (Virginia does not report cases by vaccination status). The rapid growth may be fueled by the new Delta variant, for which there is clear evidence it is much more contagious than earlier variants, likely because Delta generates a much larger viral load in infected individuals than the earlier virus strains. There are still several hundred thousand unvaccinated people in Fairfax County, and thus lots of people for an opportunistic virus to infect. This pandemic is not over yet. Tell all your unvaccinated friends to get vaccinated right away if they can. Maximum vaccination is a key to stopping this virus.
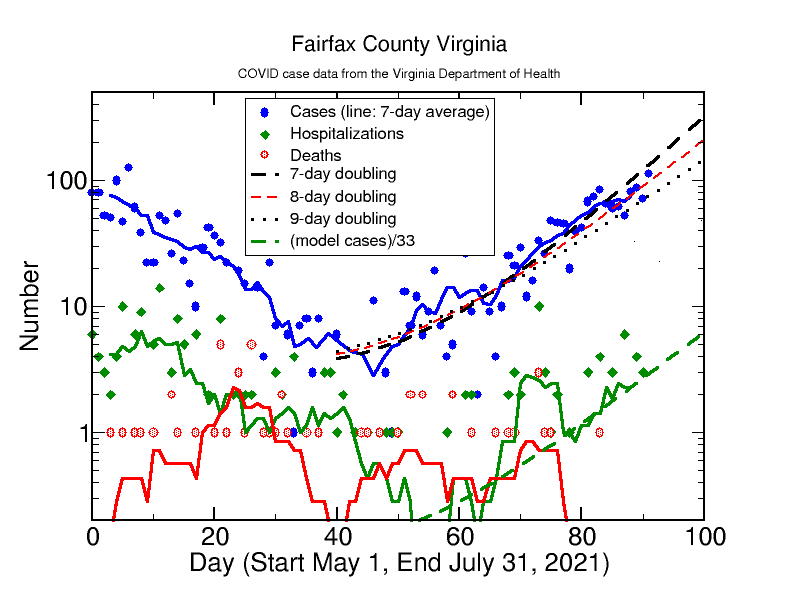
The alternative logarithmic presentation below of the same data gives a better idea of the hospitalization and death data and their fluctuations. Hospitalizations tend to a few per day, varying between 0 and 10 over the last two weeks for a 2-week average rate of 2 per day. There have been many days recently with no reported deaths. There have only been 3 reported deaths in the last two weeks, representing an average of one death every 5 days. So there has been very little severe illness in Fairfax recently, compared to earlier in the pandemic.
.
Addendum July 27: there were only 52 new cases reported on July 27 (Day 87), lower than the model predictions with 7-day doubling (but consistent with a 9-day doubling period). But there were also 6 new hospitalizations, the most for a single day since July 13, two weeks ago. But large daily fluctuations mean that only long-term averages over 1 to 2 weeks are good for (short-term) projections of cases, hospitalizations, or deaths. At some time in the future the case curve is bound to slow down and turn over again–the big unknowns are when and how high cases will rise before that happens. I will update in a couple weeks to see how this goes.
Addendum July 28: there were 81 new cases reported today. Given the daily fluctuations, this is essentially consistent with the model predictions (89 for 7-day doubling). There were no new hospitalizations or deaths reported. Cases continue to go up, but hospitalizations are remaining stably low at a weekly average of less than 1 per day, as is the death rate of only 1 every 7 days for the last week.
Addendum July 29: the 87 cases reported today continue to track the model predictions. There were 4 new hospitalizations and no deaths
Addendum July 30: the 71 cases reported today continue to track the model predictions. There were 3 new hospitalizations and no deaths
Addendum July31: Cases continue to track the model; there were 122 new cases today (the most since May 7), but no hospitalizations and deaths. I have added a new model line on the graphs representing an 8-day case doubling period. The data still seem most consistent with doubling within 7 or 8 days (5 days is too fast, 9 days is too slow). There have been 16 hospitalizations in the last week, for an average of 2 a day now, but only 1 death in the last two weeks. I have also added a new line based on my analysis of Fairfax data from March 2020 to March 2021, which showed there had been approximately one hospitalizations for every 33 cases. This line gives a good account of the current rate, showing that my model predicts that hospitalizations are just now rising “out of the noise.” It thus predicts that hosptializations are likely to continue to increase at a similar doubling rate over the next few weeks. My March 2021 model for deaths predicts that deaths follow cases by 14 days and correspond to one death for every 200 cases (but for people over 65, the death rate was much higher, around 1 in 9 cases). This model is also consistent with the current very low death rate. But it predicts that within about 3 weeks from now we should be seeing a significant uptick with one or more deaths per day due to the high number of cases now. The models, with a 7- or 8-day doubling time for cases, predicts the death rate by mid September will grow to exceed that of the peak of the pandemic last January, with most deaths for people over 65. Pray that the rapid doubling can be halted and the predictions of my model will be proven false. Encourage all your friends and family to get vaccinated if they have not done so already. I consider it now to be prudent to wear a mask in any indoor public space (e.g., grocery stores, churches, etc.). All public health authorities are clear that vaccines are one of the best tools in the toolbox for stopping this persistent pandemic and preventing the more serious forms of the disease, especially in older people. All vaccines in use in Fairfax County are safe, much safer than contracting this deadly disease, which still remains a serious threat to the heath of all of us.
