Note: See Addendum for Aug. 27 at the end.
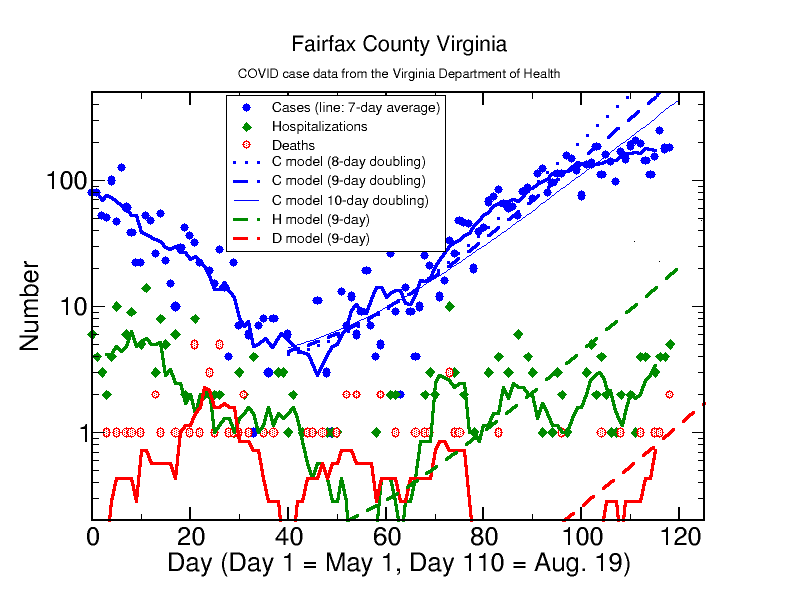
It is time to update my last analysis of COVID-19 in Fairfax County for July 2021. The news is better this time. I use a log graph to show the data and models here since this shows better the small values for the hospitalization (H) and death (D) data. Cases (C) continue to rise, although there seems to be a clear trend away from an exponential doubling rate; see below for the model assumptions. The dark blue dashed line for a model with a 9-day doubling rate is closer to the data now, showing that my original increase with a 7-day doubling has slowed considerably. The data also may be trending away from a doubling model. That is good and it is precisely what I expect to happen. A slowdown happens in part because people begin to take more precautions. It is just a matter of when turnover will happen. Time will tell whether we are already approaching a turnover in cases, or whether they will continue to go up a lot before the turnover happens.
Hospitalizations and deaths remain remarkably low in Fairfax, in spite of the rise in cases. Daily numbers are “in the noise,” so to speak, and not statistically significant yet. They remain around half of my model predictions based on the model I developed before vaccinations started (see below for the numerical formulas). The present weekly average data translate to around 60 hospitalizations and 4 deaths per month, much lower than even April or early May when cases were dropping.
The low H and D rates may be because the vaccinated fraction of over-65 people in Fairfax is very high now (over 80 percent). People in this group have been the ones who are most likely to be hospitalized or die (in the past year and a half, 82 percent of deaths from COVID-19 in Fairfair County have come from people over 65, although they represented only 10 percent of total cases). If there are few older vaccinated people among the new cases, there will be a reduction in H and D. I do not have a breakdown of recent cases by age to test that hypothesis quantitatively. But I have a strong hunch that most cases in Fairfax now are among younger unvaccinated people.
So the message is to take reasonable precautions, even if you are vaccinated, especially if you are older. I do wear a mask now when in indoor public spaces. But there is no reason for anyone to panic, especially if everyone seeks to adhere to sound practices for maintaining public health, such as being vaccinated, plus masking, washing hands, and distancing where common sense indicates that it would be appropriate. COVID-19 is likely to be with us for a long time, and we can learn to live with it, especially if we can achieve high vaccination rates.
I put a lot of faith in the common sense practices of ordinary people to protect themselves and their children if they are given sound scientific and medical information by responsible sources. We can do without politicians and doomsayers who only sow a lot of confusion and cause untold harm.
Model assumptions
The exponential doubling model I use is the following: C = 3 + 12 x 2(d-64)/T, where C = cases, d = day (Day 0 = May 1, 2021), and T = doubling time. The formula assumes a “background” case rate of 3 per day, the minimum at day 46, and is constrained to have a total of 12 cases per day on day 64; all model graphs go through the (d=64,C=12) data point. The number of cases above the background value of 3 doubles in T days. My hospitalization model is based on the model I used to relate cases C to H between March 2020 and March 2021, namely, H = C/33, or 1 in every 33 cases results in a hospitalization. My model for deaths D from the same data set is D = C-14/200, that is, there is 1 death for every 200 cases 14 days before (C-14 indicates cases 14 days prior), that is, there is an average 2-week delay between onset of a positive case and death.
Addendum for Aug. 27
The graph includes COVID-19 data for Fairfax County through Aug. 27. The case rate definitely tends to be slowing, with a weekly average case rate of around 180 cases per day, thankfully much less that predicted by the doubling models. However, hospitalizations and deaths rates are ticking up in an expected yet discouraging way due to increased cases. In the last week there were 24 hospitalizations and 6 deaths in Fairfax County, up from 6 hospitalizations and 1 death in the previous week. In fact, this week Fairfax had its first COVID-19 death of a child under age 18 since the start of the pandemic. Of the other 5 deaths this week, 3 were over age 64 and 2 were in the 50-64 age group.
The new data I have been collecting for the past 2 weeks show that cases in the under 18 age group are up by 73 percent, whereas cases over age 50 are down by 23 percent. Hospitalizations seem to be running about 1 in 60 cases, lower than the pandemic average of 1 in 33 cases for Fairfax County. However, deaths seem to be catching up with my model predictions of around 1 in 200 cases. These rates are still low compared to the rest of the country, especially Florida, where the current case, hospitalization, and death rates per 100000 population are respectively 7, 17, and 14 times higher (that is, 700, 1700, and 1400 percent higher) than those in Fairfax County this past week. Fairfax is still relatively safe, certainly so compared to Florida.