
- Update Jan. 31, 2022: cases going down, hospitalization and death rates per case remain very low.
- Update Dec. 31: basically same as yesterday with a new all-time high 0f 3111 cases and a revised model to better account for all the data.
- Update Dec. 30: basically the same report as yesterday with a new all-time high.
- Update Dec. 29: cases reached an all-time high today, although lower than the growth model; hospitalizations are increasing slower than model predictions.
- Update Dec. 28: A post-weekend readjustment to the data shows cases still high, hospitalizations not yet rising much, but unfortunately deaths are up.
- Update Dec. 27: some good news: cases are now dropping and hospitalizations remain lower than model predictions.
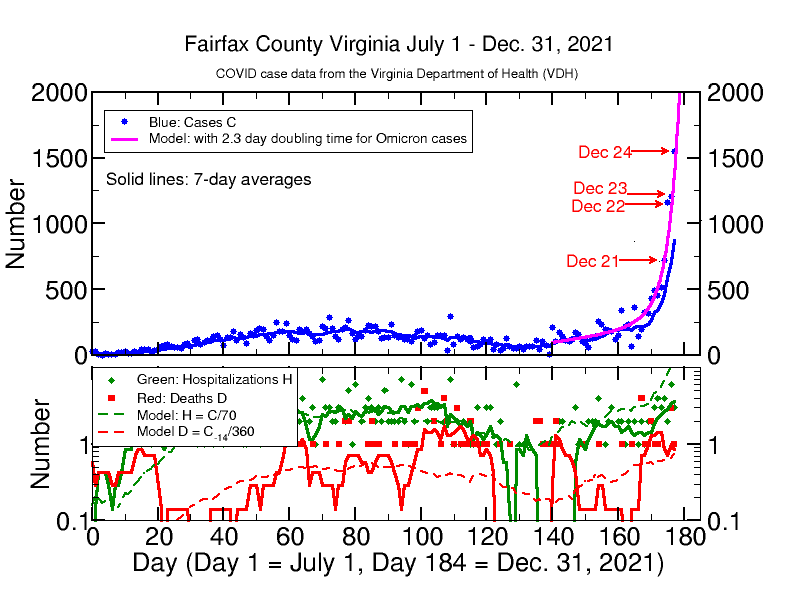
- Update Dec. 24: 1550 cases today exceed model predictions by around 200 cases; hospitalizations are rising less rapidly than the model predictions.
- Update Dec. 23,: 1209 cases today again exceed model predictions; hospitalizations are beginning to rise.
- Update Dec. 22: 1189 cases today again EXCEED MODEL PREDICTIONS from Dec. 20, as did the 720 cases for Dec. 21 with continued analysis of the impact
- Original analysis of Dec. 20 with simple mathematical model of the recent rapid rise in Covid cases in Fairfax and some analysis of the impact
Dec 31 update:
Today saw an unprecedented all-time high number of over 3000 daily cases. Hospitalizations are slowly rising–the 7-day average of 6 is clearly higher than the former long-term average of 2–BUT the number still remains around one fourth of my model predictions based on the C/H ratio of 70. The 7-day average of C and H data yields C/H = 280 for the current ratio. This is MUCH BETTER than it had been and remains the one good news in all this. The reason we have more daily hospitalizations now (6 instead of 2) is the dramatic rise in cases–the sheer number of cases makes the difference.
I have revised my model once more to account better for the pre-Christmas and the post-Christmas data. The double exponential model assumes more cases (10) on Dec. 1 and a longer doubling time of 3.7 days, which is close to the 3.4 to 3.6 day doubling time reported for the Omicron variant in S. Africa. The magenta line of the graph shows the new model, this time on a log scale. This model better accounts for the natural statistical variation in the data and the continuing post-Christmas rise.
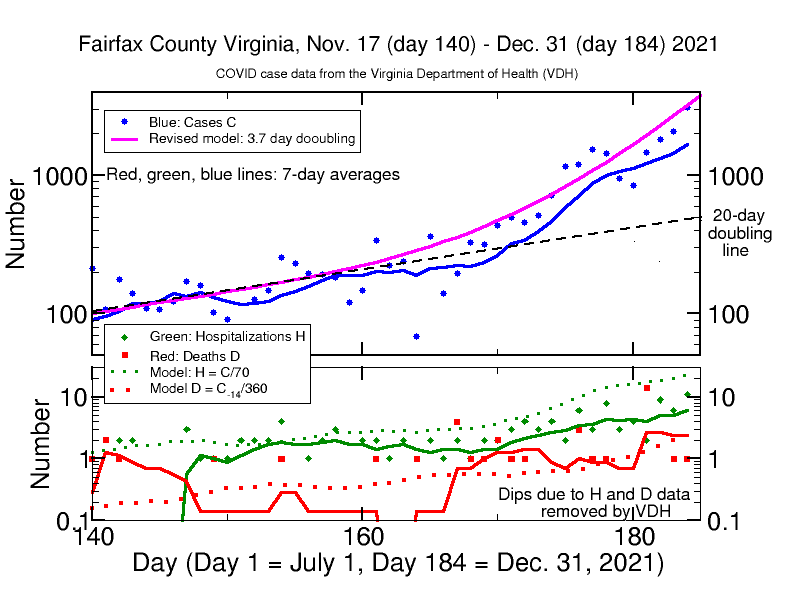
Deaths remain low, but my model predicts that we should be seeing a rise the daily number in the next few days. Let’s hope this will not happen. If we delete the sharp jump due to 14 deaths added on Dec. 28 (see next sentence), the actual data line through Dec. 31 would show no increase at all, with only 3 new deaths reported in the last 7 days. The reason for discounting the 14 is that VDH said they were due to reporting prior out-of-state deaths by residents of Virginia that had been reported by other states, with a delay in reporting (VDH reports deaths of Virginia residents, wherever they occur). In other words, this was a “catch up” report of old data, not a report of new deaths (there may have been 1 or 2 new local deaths in the 14, but we have no way of knowing). So the recent jump in the 7-day average is much more likely to be artificial than real. It would be good news indeed if there were no spike in deaths at all due to the new surge in cases. That is what has been reported from S. Africa–their big surge of Omicron cases resulted in very few new deaths for such a large number of cases. We should know after a new week of data here.
Dec 30 update:
The report for today is basically the same as yesterday. The 2064 new cases reported today represents a new all-time high number for a single day in Fairfax, and the first day with over 2000 cases. This number is on-target with the prediction of my revised growth model from yesterday. The story about hospitalizations and deaths remains the same as yesterday.
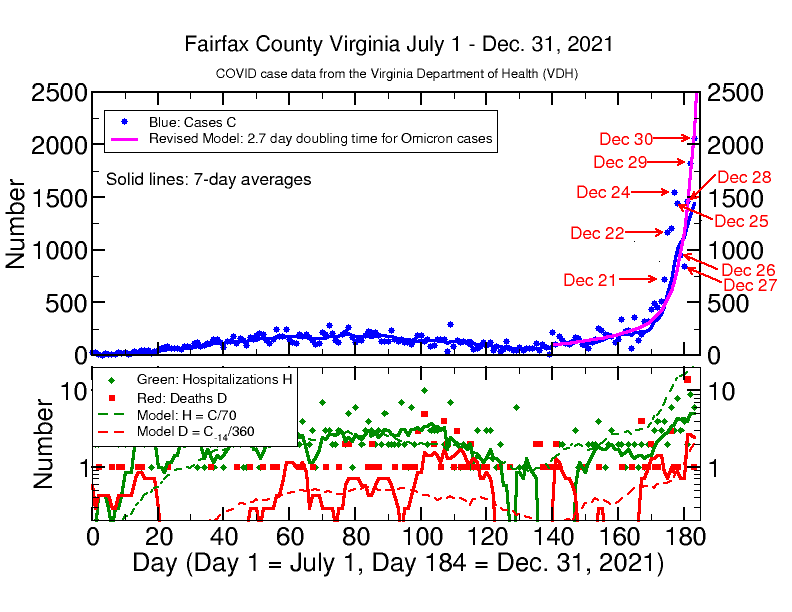
Dec 29 update:
The cases are up again today to an all-time high of 1825 cases in a single day. Since cases seem to be rising less rapidly than in my original Omicron model with a 2.3 day doubling time, I have revised the magenta model on the graph to have a 2.7 day doubling time. The revised line accounts better for post-Christmas cases, but under-counts cases in the days before Christmas. But fluctuations in case counting is normal, with a standard deviation of 50 percent or more. Furthermore, two things were happening in those days: the absolute number of PCR tests was increasing (but not as fast as cases) and the (7-day average) percentage of positive tests was rapidly increasing from a few percent to 17 percent. Therefore, we need to continue to watch the situation carefully. The increase in test positivity confirms that the rapid increase is real. What remains to watch is how high cases go before peaking and how quickly they begin to decrease. Meanwhile, Fairfax is experiencing by far the highest number of actual Covid cases C that it has EVER HAD. This is going to lead to hospitalizations H and deaths D determined by the operative the C/H and C/D ratios. See the next paragraph.
There have been 35 hospitalizations H in the last 7 days and 9275 reported cases, giving a ratio C/H = 265. This is nearly 4 times better than the ratio C/H = 70 assumed in my model based on Delta cases between July and November, 2021. Let us hope this improved number holds. The rise has been so rapid and this ratio does not account for a time lag of a few days between case onset and hospitalization, so the true number likely lies between 70 and 265, but closer to the latter. Again, the rapidity of the rise does not yet allow me to make an estimate of the impact of the case to death ratio C/D. Current deaths are increasing and have a magnitude similar to my model prediction that we should be having around 1 to 2 deaths per day in Fairfax now, based on the known number of 14-day past cases using the C/D ratio =360. The spike in death count due to 14 new deaths being added by VDH to the count yesterday has skewed the observed ratio–it should become clearer in the next week or so what the proper ratio is for our current surge. If this ratio applies, the 9275 cases reported in the last 7 days will result in around 26 deaths, primarily in people over 65 years old, beginning about a week from now. Of the 20 deaths reported in the last 7 days, 15 (or 75 percent), were for age 65+, 3 (or 15 percent) were for the 50-64 age group, and the remaining 2 (or 10 percent) were for adults under 50.
Dec 28 update:
As expected, the data posted after the long weekend catches up on low numbers over the weekend. Cases remain high with 1464 reported today (reflecting those counted Monday). And unfortunately 14 new deaths were added to the list today, the highest number in a single day since last March 3. Today’s report is most likely due to catching up with prior deaths over several days that had not yet been reported rather than 14 in one day. There now have been 19 deaths reported in the last 7 days, making an average near 3 per day. This is much higher than the model expectations and the actual average, both of which have remained near or below 1 death per day during the last 2 months.
The good news is that daily hospitalizations remain stable near 4 per day, which is a rate around 4 times lower than the model prediction of 17. This could reflect two factors: my model does not have a time-lag between cases and hospitalization, other than the intrinsic lag built into a 7-day average, Consequently, my model will work better when cases are varying slowly over a 7-day interval, although it will have a few-day lag when cases are rising rapidly over 7 days, since it is based on the average instead of the current number of cases. The other reason for the difference of actual and model hospitalizations is that the model assumes too low a number the C/H ratio. Instead of having 1 hospitalizations per 70 cases (C/H=70), perhaps we are having only around 1 hospitalizations per 300 case. That would be quite good news. But only future data can let us back out the actual C/H ratio that will account for what is measured. For comparison, the current C/H ratio for the Omicron surge in Denmark is around 1 hospitalization per 90 cases. But please note, in 2020 prior to any vaccinations, the C/H ratio in Fairfax was 1 in 33 cases. Consequently, we are already doing much better than in 2020.

Dec 27 update:
Today VDH released the first new data in 3 days, due to the long weekend when reporting was shut down. The graph shows that daily cases have been dropping for the last 3 days, having reached an all-time high on Christmas Eve. This is very good, since cases had been running ahead of model predictions through Dec. 24. While case number usually drops on weekends (a persistent pattern), it does appear that the rapid ramp-up is actually slowing (as it eventually must). However, case numbers remain much higher than they were even a week ago; this is not due to increased testing that catches more cases, since testing is only up by 50 percent or less, whereas cases and the testing positivity rate are up by several hundred percent. There really are a lot more cases now. It will take a few more days of data to see if cases are actually slowing significantly. We still may be in for a time of a relatively high number of cases.
Although there were 8 hospitalizations reported on Dec. 25 (for the day prior), there have only been 7 more added in the next 2 days, giving 15 hospitalizations in 3 days for a 3-day average of 5, compared to a 7-day average of 4. While this is higher than the previous 7-day average of 2, it is much less than the model predictions of around 15 daily hospitalizations we might be having now, based on 1 hospitalization per 70 cases that had been characteristic of August and September. Let us hope that this good news about a lower hospitalization rate is borne out by future data. The number of new deaths continues to remains low and stable at around 1 per day in the 7-day average; this value is similar to the model prediction, since deaths typically lag case onset by a couple of weeks.
It will be important to watch the data for the next couple of weeks to know whether the impact on Fairfax County will remain moderate to low or not. There are reasons for being cautiously hopeful regarding serious disease, if only because of the high rate of vaccination here. Preliminary data from Denmark, which is similar to Fairfax in Covid control, is indicative of cautious optimism. Except for the age groups under 11 and over 85, over 82 percent of Fairfax citizens have at least one dose, over 72 percent are fully vaccinated, and over 62 percent of those 65 to 84 are boosted. That should offer major protect against severe cases in the most vulnerable age group and mitigate the severity of the disease in younger people. Perhaps surprisingly, the 85+ group lags the 65-84 age group in vaccination status, and may suffer disproportionately.
Dec. 24 Update:
The graph shows the update of Fairfax Covid data for Dec. 24. While cases continue their rapid rise in excess of my model, there is some relatively good news. The number of new hospitalizations reported was only 3 in today’s report, compared to 6 yesterday, and more in line with what they have been. While hospitalizations are definitely increasing from the previous level, they are currently running only at around 25 percent of my model predictions. That is good news, so let’s hope this continues. Furthermore, deaths are remaining low (as expected) at around 1 per day. Interestingly, in the surge of the last 7 days, the 65+ age group has only contributed 4 percent to all cases (188 of 4428), down from the 8 percent of the total during the last few months. While cases are up among the 65+ group, they are rising much less rapidly that in the younger age groups that account for almost all of the rapid rise. The 65+ age group in Fairfax is the most highly vaccinated (around 95 percent) and boosted group in Fairfax, so the wisdom of our older citizens in getting vaccinated looks like it is paying off.
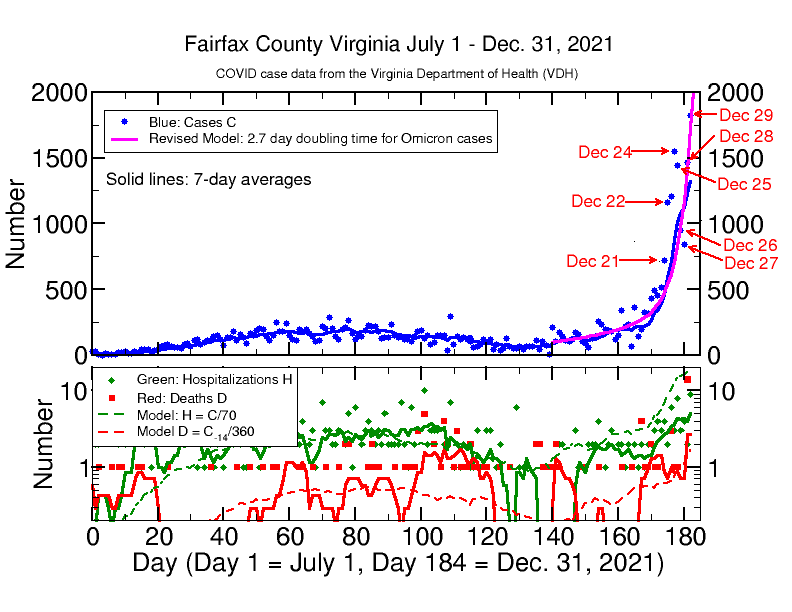
Dec 23 Update:
The VDH Covid case number for today, 1209, again exceeds my model prediction of 1080 cases. Hospitalizations are also just now pulling out of the “noise” of statistical variation: there were 6 hospitalizations reported today (reflecting admissions yesterday), which are below my model prediction of 10. This reported number 6 is much higher than the average of 2 per day we had been having for several weeks prior. The lower reported number than the model number could be due to several of 3 reasons: statistical uncertainly due to daily variation, a 3 to 4 day lag between a positive test and the need for hospitalization (which my model does not take into account), or an actually lower hospitalization rate for cases with the Omicron variant than with Delta. In any case, we should know in the next few days whether or not the hospitalization rate takes off exponentially in Fairfax County. I expect that it will, with the only currently unknown factor for Omicron being the case to hospitalization ratio C/H (the available data, while limited, suggest that it may be within a factor of 2 or so of the model assumption of C/H=70). Deaths remain low at around the 1 death per day rate we have seen recently in Fairfax. Deaths are running slightly ahead of my current model predictions of a 0.65 death per day average, but do not yet show any evidence of exponential increase, since the model assumes an average 14 day lag between case onset and death.
The graph shows the data through Dec. 23. The impact remains the same: Fairfax is experiencing a rapid growth of new Covid cases due to the highly contagious Omicron variant. Fairfax is likely to see rapid growth in hospitalizations and deaths in the coming days and weeks as the new wave of infections plays out. At some yet unknown time in the next few weeks, cases will peak and probably rapidly decrease, just as they have rapidly increased. The main danger lies in the large and unprecedented number of rapidly increasing daily cases. There is a basis for a legitimate hope that Omicron might turn out to cause less severe disease for many individuals in our local population, because it may be less severe itself and because there is a high degree of protective vaccination already present. Time will tell.

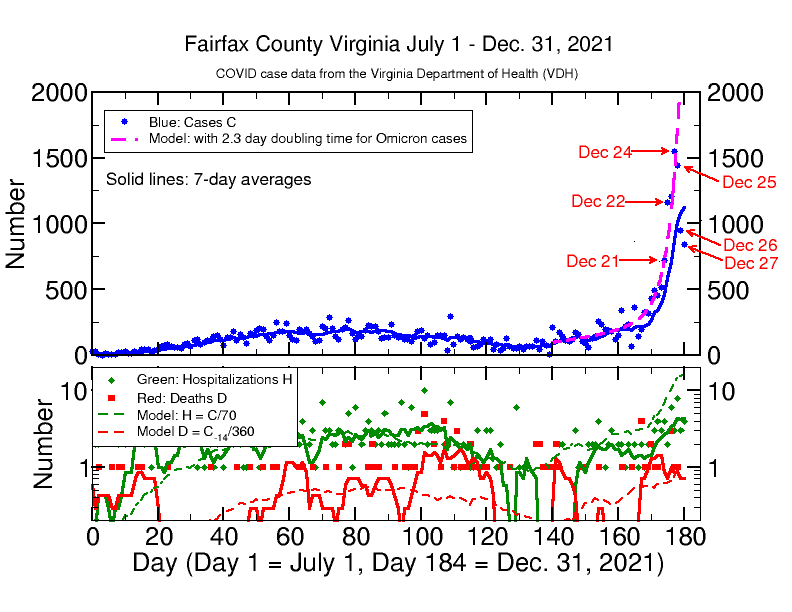
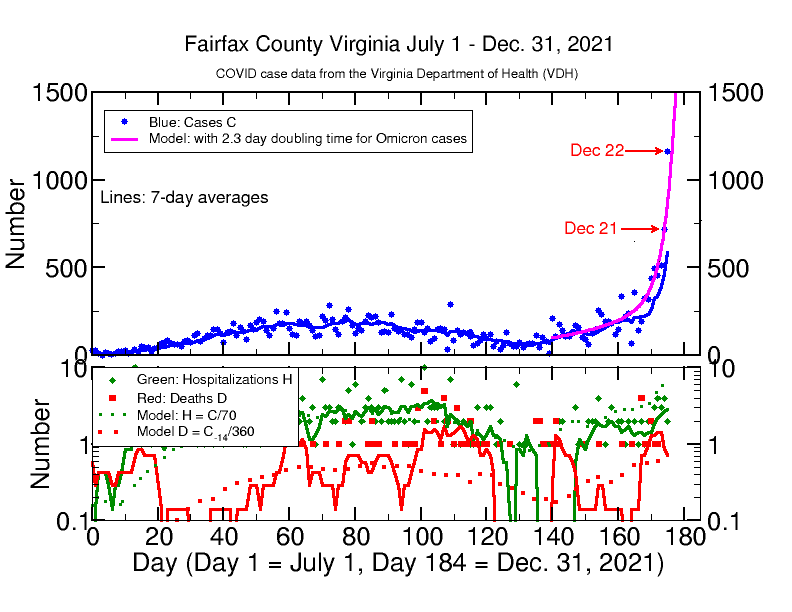
Dec. 22 Update:
The Virginia Department of Health Covid case number for today, 1189, exceeds my model prediction of only 748 cases. I have adjusted the doubling rate to 2.3 days in the model on the graph below. This accounts for yesterday’s cases, but still falls short of today’s number. If this model is correct, Fairfax will have over 1800 cases on Christmas Eve, and we may have even more; we are not likely to be having less. The most cases ever in a single day in Fairfax was 1485 on Jan. 17, 2021, and the average daily number has never exceeded 750. If the model continues to apply, we will be having over 10,000 cases per day by New Year’s Eve. So far there is no exponential rise in daily hospitalizations H or deaths D. This is to be expected given the very rapid onset of cases, since there is a time lag between case onset and and H or D events, around 14 days for the D and probably a few days for H (I have not modeled that yet). So far D has remained around 1 per day and H has shown an increase from 2 per day to 3 or 4 per day. H and D are still “in the noise” of the statistical fluctuations of the data. I expect both soon to rise. See the analysis below.
Dec. 22 Update: Likely impact
The presence of an unprecedented number of Covid-19 cases due to the highly contagious Omicron variant is now undoubtedly with us in Fairfax County. Cases are rising exponentially and are likely be in the thousands per day in the next few days. The big open question is how serious these cases will be? There is evidence that Omicron might be less severe than previous variants. But the sheer number of cases can still result in a lot of serious disease, especially among the unvaccinated. Will we have so many cases as to see unprecedented numbers of hospitalizations that saturate and break down our excellent health care system, denying needed care to many? This has previously happened elsewhere in the USA due to other variants. Will we see a large number of extra deaths due to the very large number of cases, even if it is a less severe disease? Having had a previous case of Covid seems to provide little protection against Omicron, and even 2 doses of vaccine are not as effective as they were against earlier variants, although having a booster gives effective protection against catching the disease. Vaccines are definitely believed to make a case less severe if you should have one. Older people remain at risk–if you are fully vaccinated, your odds of dying of Covid if you are over 65 are not negligible, although several times better than for unvaccinated people. For comparison purposes, the odds of dying of Covid if you are 65 or older and tested positive for it (via a PCR test) during the recent Delta surge in Fairfax are 1 in 25 cases (68 deaths out of 1699 cases in Fairfax for people of unspecified vaccination status 65 and older since Aug. 15) Younger people have much better odds, closer to that of the seasonal flu.
So the real question is what is the case to hospitalization ratio (C/H) and case to death ratio (C/D) with Omicron. These have yet to be established. For the recent Delta surge, the ratio for Fairfax County was 70 for C/H and 360 for C/D: that is, 1 in 70 cases caused a hospitalization and 1 in 360 cases resulted in death. These ratios cover all ages and do not consider vaccination status; as mentioned above, for people 65 and older, the C/D is 25. Suppose the new model is right and Fairfax experiences thousands of cases. Assuming 10,000 cases, using the ratios that applied for Delta, there will be 140 hospitalizations, 28 deaths, probably around 22 of them in people over 65. The numbers will be skewed towards the unvaccinated, but with many breakthrough cases there will be a number of seriously ill people who are fully vaccinated (my guess: around 20 percent of the totals). Currently there are only 37 staffed ICU beds available in the various hospitals in Fairfax County, since the other 193 beds are currently occupied, mostly due to non-Covid illnesses. Thus, our hospitals have very limited capacity to absorb a wave of many dozens of new serious Covid cases per day (we handled them earlier, but cases have never been this many so fast). Our system could become saturated in a matter of a few days, and all seriously ill people will suffer whether they have Covid or not. It has happened elsewhere. If we has 10,000 cases PER DAY, as the model predicts by New Years Eve, you will need to multiply these numbers by how many days this goes on. An nobody knows how long that might be.
If I take an educated guess, it is clear that exponential growth is not sustainable for long–something always happens to slow or stop it. For example, people realize how dangerous the situation is and take extra (or extraordinary) precautions against catching or spreading the disease. Or perhaps the Omicron virus finds all the susceptible people it can infect, rapidly runs through them, and then disappears. This rapid ramp up WILL DEFINITELY STOP at some point, and cases will begin to decrease again. A slowing is certainly possible even before we could reach 10000 cases per day by New Year’s Eve. I certainly hope so, but hope cannot make things happen. We just don’t know when. Perhaps better modeling experts than me have good projections on when things might turn around and cases go down again–in which case we should listen to them. Meanwhile prudence means taking all necessary precautions to protect oneself, one’s family, and one’s neighbors. Such steps might turn this thing around quicker than you think.
New Omicron Model (the text below is from my earlier post of Dec. 20)
I don’t want to be alarmist, but the Covid data from the last few days in Fairfax County is highly suggestive that the new Omicron variant is already here and causing a VERY RAPID (exponential) increase in cases with a doubling time of around 2.4 days. The data for the last several days nails the reality of an increasing case rate–no ambiguity here. The last time Fairfax has seen over 450 cases 3 days in a row was last Jan. 16-18 at the peak of the “post-Christmas surge” a year ago. The rapid increase is consistent with the doubling time that has been observed elsewhere (S. Africa, Denmark, the UK, New York) with the new Omicron variant. One cannot be certain yet about the impact here–i.e., hospitalizations, deaths, crash of the healthcare system–but signs are ominous. So PLEASE BE WARNED AND TAKE ADEQUATE PRECAUTIONS.
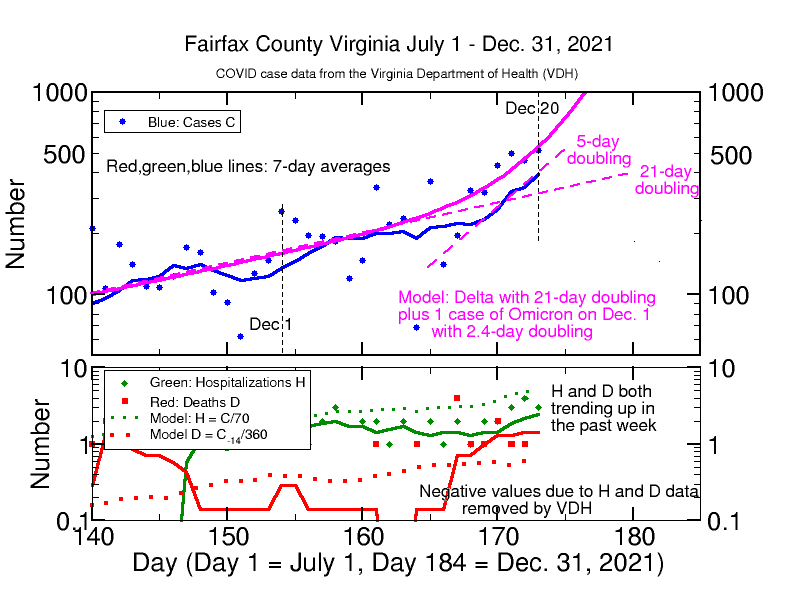
The graph below is like the ones in previous posts (see this for an overview, this for recent details, and this for a description of my former models). The upper panel shows confirmed (by PCR tests) cases since July 1 (blue dots) reported by the Virginia Department of Health (VDH). The solid line shows the running 7-day average of cases, which smooths out statistical variations. Since the middle of November, the case rate has been consistent with slow exponential growth with a 21-day doubling time. The data for the last 7 days show a new growth pattern with an approximate 5-day doubling of cases in the 7-day average (this will be more apparent in the log graph on my website). However, a 7-day average will smooth over faster growth rates. I can fit the actual case data with a very simple model with a faster growth rate. Please note well: it is only a model and certainly not the only possible model for explaining the high number of cases. While I hope it will prove to be wrong in its projections, it does seem realistic given the known properties of the Omicron variant. It is my intuition based on watching daily Covid-19 data for Fairfax and other places on a daily baisis for over a year and a half now that leads me to think that the model may be correct, at least for projecting increasing cases in the coming few days. Cases will eventually peak and start to decrease again at some unknown point in the future.
The model assumes a continuing “background” of Delta cases with the 21-day doubling rate that has accurately accounted for the data during the last 4 weeks. Then I add in a model for Omicron cases, assuming there was 1 case on Dec. 1 with cases growing by a 2.4 day doubling time since then. This gives the magenta curve on the graph that can account for the rapid rise in recent cases. If the model projections hold, we will be having more than 1000 cases per day in Fairfax by Christmas Eve. I hope the model is wrong, but you at least can see what exponential grown can do–and it looks like we might be having that here now. Omicron cases have been rising with a 2 to 4 day doubling time elsewhere, so this kind of growth is entirely plausible if Omicron already is starting here.
Dec. 21 Update: With 720 cases reported today, we are on track to have around 1400 cases Christmas Eve.
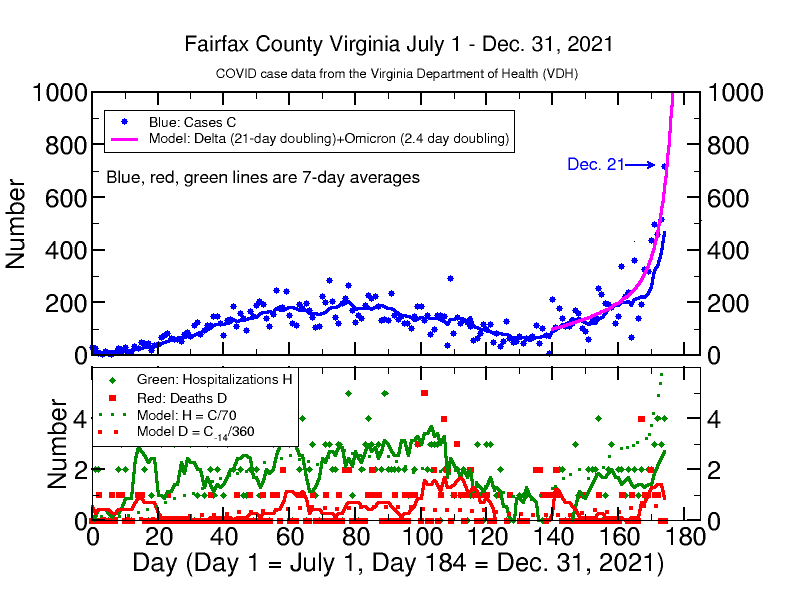
The model is specifically the following: C = 100*2^((D-140)/21) + 1*2^((D-154)/2.4), where C = cases, D is the day index (Day 140 = Nov. 17, 2021, Day 154 = Dec 1, Day 173 = Dec. 20), and 21 or 2.4 in the denominator of the exponent is the doubling rate per day; the 2^ symbol indicated raising 2 to the power given after the ^ symbol.
Let me add one note about the data sources. I use the Virginia Department of Health data (or see this link for data for all Counties in VA), which is different from and lower in case number from the data released daily on a data dashboard maintained by Fairfax County. The reason is that the Fairfax dashboard also reports probable cases as well as those confirmed by reliable PCR tests. However, Fairfax also keeps tabs on cases, hospitalizations, and deaths by age group. So I use the Fairfax data base for that information.
Impact
What about vaccination status? Well, with 67.6 percent of our 1.15 million population fully vaccinated, we have around 370,000 people in Fairfax County who are not yet fully vaccinated and 270,000 with no vaccination at all (includes a lot of children). The least vaccinated groups in Fairfax are those under age 50. That is a lot of people for a highly contagious virus to find and drive a full-fledged pandemic. Data by age in Fairfax shows that 80 percent of the recent cases and most of the increase occurs in those under 50, including children. There are relatively few cases (10 to 20 per day) among those 65 and older (this group has a high vaccination rate around 95 percent). Furthermore, some medical evidence indicates that 2 shots of any of the vaccines give little protection against catching the Omicron mutant, although a 3rd booster shot does seem to be effective. But the medical evidence also indicates that vaccination, even with 2 shots, does provide protection against hospitalization and death, although the amount of protection is not yet clear. It may be that Omicron is less severe that earlier variants, but that also is not clear yet (there are contradictory studies on this).
Most of the deaths in the earlier pandemic phases were among older people 65 and older (80 percent of deaths). Let me put it this way: in the previous phases of the pandemic, if you were over 65 and received a positive PCR test for Covid you had a 1 in 10 chance of dying from it in Fairfax County if you were unvaccinated (Yes, the data show it was really this bad for us old folks). Vaccination improved the odds to anywhere between 1 in 20 to 1 in 100, depending on which data you use to estimate the odds. I think 1 in 50 is probably realistic for people over 65. The odds are not likely to be any better than that with the Omicron variant. Younger people had much better odds against dying in the earlier pandemic phases, only 1 in 1200 cases resulted in death in Fairfax County if you were under 50. Thus, the data from earlier in the pandemic show that the spread and transmission of the disease is primarily driven by people under 50, and most of the dying is done by people 65 and older. It is likely to be similar with Omicron.
Can Fairfax handle this surge?
So far Fairfax has consistently done better than the rest of America in dealing with this pandemic, by any measure one chooses to apply. If we should have thousands of new cases per day here, what is Fairfax’s capacity to deal with such a rapid ramp-up in cases (we may be only a few days away from that!!!)? According to published health data, Fairfax has 230 staffed adult ICU beds. Currently (Dec. 20, 2021) 183 of these are occupied by non-Covid cases (e.g., heart attacks, strokes, etc) and 11 by Covid cases. That leaves 36 available ICU beds should they be necessary. That is a very thin layer of protection if we should ramp up to an unprecedented 1000s of Omicron cases. If my model is right, in 6 days (Monday, Dec. 27) we should be having around 2000 cases per day, which will result in around 30 hospitalizations per day, given the current 70 hospitalizations per case in my “Delta” model. It would not take long to fill up our ICU capacity with new Omicron cases if it proves to be moderately severe, especially if it is effective in infecting older people.
Currently my graph shows that the hospitalization rate of around 2 persons per day is lower than my model predictions but hospitalizations have started increasing rapidly (14 in the last 4 days compared to 7 in the previous 4 days). The death rate of around 1 per day has increased nearly 10-fold in the last week due to a spate of recent deaths (10 in the last week, after only 3 in the previous 3 weeks). Only time will tell what the outcome will be, so be prepared. It is highly likely that we are in for a rough spell.
Risk analysis
There is a web-based tool developed by Georgia Tech, Duke and Stanford to estimate the risk of having a Covid positive person present at a gathering of a given size for any county or state in America, based on real-time data. According to the tool (and the tool data may be a day or so behind), there is now around a 50 percent probability of having such a person present in a gathering of 100 people in Fairfax County, and a near-certainty for a gathering of 500 or more people (risks will depend slightly on which assumptions you use with the tool).
What should one do?
In addition to being vaccinated and boosted, wear a mask in all public spaces, especially avoid crowded indoor spaces like restaurants or events with lots of people, avoid unnecessary social contacts until we see how this thing develops. I would not be attending any event with more than a couple dozen people or so. My family started putting these practices into place a few weeks ago when I could see the handwriting on the wall. Be safe rather than be sorry.
Finally, it is worthwhile to consider the counsel of the first of the seven “O Antiphons” of the Advent Season we are in right now. The Antiphon, “O Wisdom,” is:
     O Wisdom, coming forth from the mouth of the Most High,
           reaching from one end to the other mightily,
           and sweetly ordering all things:
     Come and teach us the way of prudence.
May we indeed follow the virtue of ancient wisdom to be prudent in all we do.
